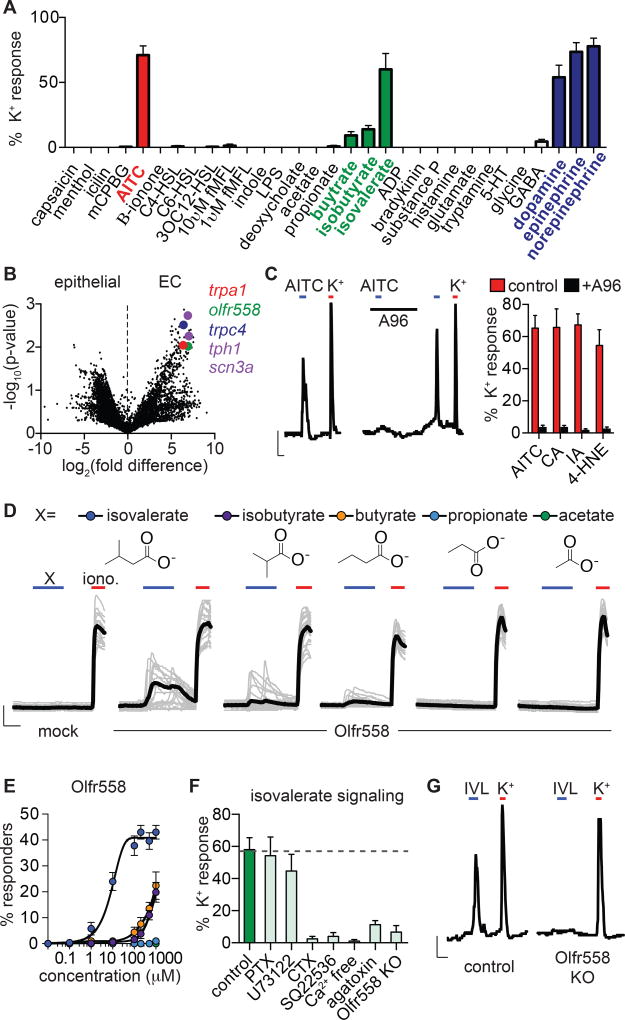
Figure 2. Enterochromaffin cells use TRPA1 as an irritant receptor and Olfr558 as a metabolite sensor.
A. Sensory molecule screen for EC cell-specific Ca2+ responses. High K+ was added at the end of each experiment to induce maximal Ca2+ responses used for normalization. n=6–62 per condition. Data represented as mean ± sem.
B. mRNA expression profile of EC cells compared with other intestinal epithelial cells shown as a volcano plot. Trpa1 (red), olfr558 (green), and trpc4 (blue) were among the most enriched transcripts that encode sensory receptors or channels. EC cell marker tph1 and NaV1.3 pore-forming subunit scn3a are shown for comparison (purple).
C. AITC (150µM)-elicited Ca2+ responses were inhibited by the TRPA1 antagonist A967079 (A96, 10µM). Scale bar: 0.1 Fura-2 ratio, 50s. Average peak Ca2+ responses evoked by TRPA1 agonists AITC, cinnamaldehyde (CA, (150µM), iodoacetamide (IA, 150µM), or 4-hydroxynonenal (4-HNE, 200µM) were inhibited by A96 (10µM). n=5 per condition. p<0.0001 for agonists versus agonists + A96, two-way ANOVA with post-hoc Bonferroni test.
D. Ca2+ responses elicited by metabolites (200µM) in HEK293 cells expressing Olfr558. Ionomycin (iono, 1µM) was added at the end of each experiment to induce maximal Ca2+ responses. Black traces represent an average of all cells in the field shown in grey. Scale bar: 0.2 Fura-2 ratio, 50s.
E. Dose-response comparing isovalerate (blue), isobutyrate (purple), butyrate (orange), propionate (light blue), or acetate (green) represented as % of cells that responded to the indicated concentration of each compound. n=6 per condition. EC50 for isovalerate was 8.92µM with a 95% confidence interval of 7.32 to 10.51µM.
F. Isovalerate-evoked Ca2+ responses in EC cells. n=5 per condition. p<0.001 for control (vehicle-treated or empty Cas9-containing vector-infected organoids) versus cholera toxin (CTX), adenylyl cyclase inhibitor SQ22536 (10µM), Ca2+ free extracellular solution, ω-agatoxin IVA (300nM), Olfr558 knockout (KO). All data represented as mean ± sem. n=5–8 per condition, one-way ANOVA with post-hoc Bonferroni test.
G. Isovalerate (IVL, 200µM)-evoked responses were absent in Olfr558 knockout (KO) ChgA-GFP organoids generated using CRISPR. Scale bar: 0.1 Fura-2 ratio, 50s.

