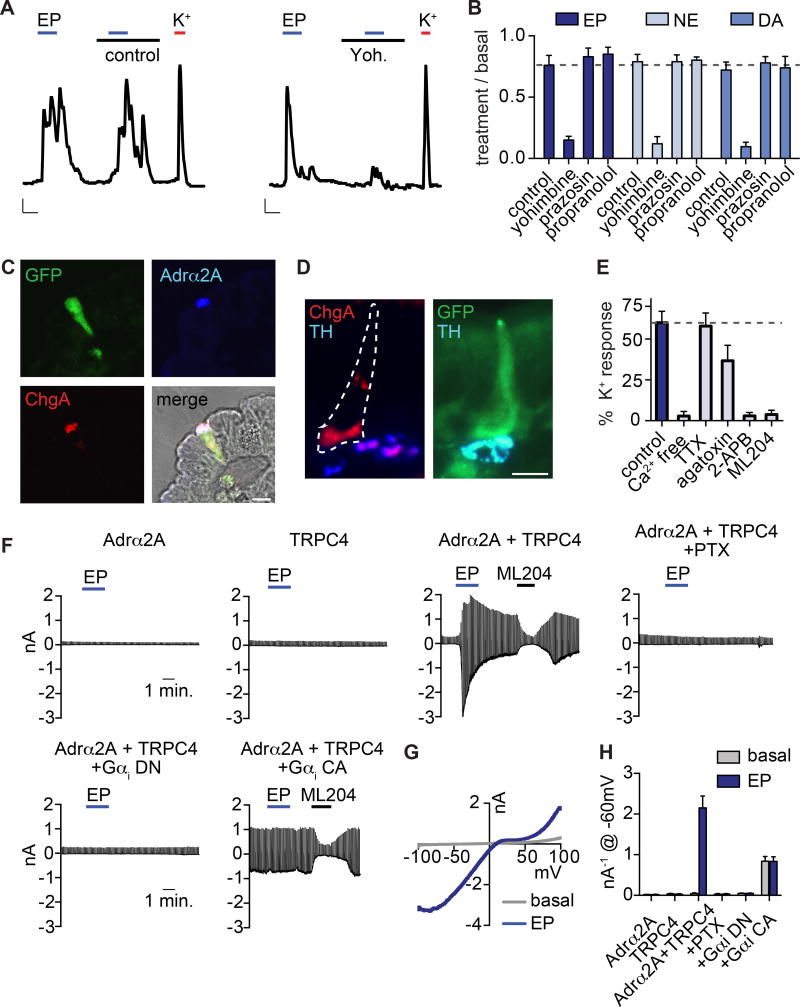
Figure 3. Adrα2A and TRPC4 form a catecholamine-sensitive signaling cascade in enterochromaffin cells.
A. Epinephrine (EP, 1µM)-evoked Ca2+ responses were blocked by the adrenoreceptor α2 (Adrα2) antagonist yohimbine (yoh, 5µM). Scale bars: 0.1 Fura-2 ratio, 50s.
B. Average peak catecholamine responses were inhibited by the Adrα2 antagonist yohimbine, but not the Adrα1 antagonist prazosin (5µM) or the Adrβ antagonist propranolol (5µM). n=5 per condition. p<0.0001 for control versus yohimbine for EP (1µM), norepinephrine (NE, 1µM), dopamine (DA, 100µM). Two-way ANOVA with post-hoc Bonferroni test.
C. Adrα2A (blue) localized to the basolateral side of EC cells (indicated by ChgA in red or GFP reporter) and was specific among intestinal epithelial cells. Scale bar: 10µm.
D. Tyrosine hydroxlase (TH, blue), a marker for norepinephrine-producing sympathetic nerve fibers, localized on the basolateral side of EC cells (indicated by ChgA in red or GFP reporter). Scale bar: 10µm.
E. Pharmacological profile of EP responses. n=7 per condition. p<0.0001 for control versus Ca2+ free, TRPC inhibitor 2-APB (50µM), TRPC4 inhibitor ML204 (10µM); p<0.05 for control versus ω-agatoxin IVA (300nM). One-way ANOVA with post-hoc Bonferroni test.
F. EP-elicited currents were elicited from HEK293 coexpressing Adrα2A and TRPC4, but not cells independently expressing Adrα2A or TRPC4. EP-elicited currents were inhibited by pertussis toxin (PTX, 200ng/ml) or coexpression of dominant-negative (DN) Gαi. Coexpression of constitutively-active (CA) Gαi induced ML204-sensitive activity that occluded EP-elicited currents.
G. Representative current-voltage relationship shows the peak EP response (blue) and basal current (grey) from the representative cell expressing Adrα2A and TRPC4 shown in F.
H. Average peak current amplitude recorded at −60mV before (basal, grey) or during EP (blue) application. n=6 per condition. All data represented as mean ± sem. p<0.0001 for basal versus epinephrine-evoked currents in Adrα2A and TRPC4, two-way ANOVA with post-hoc Bonferroni test.

