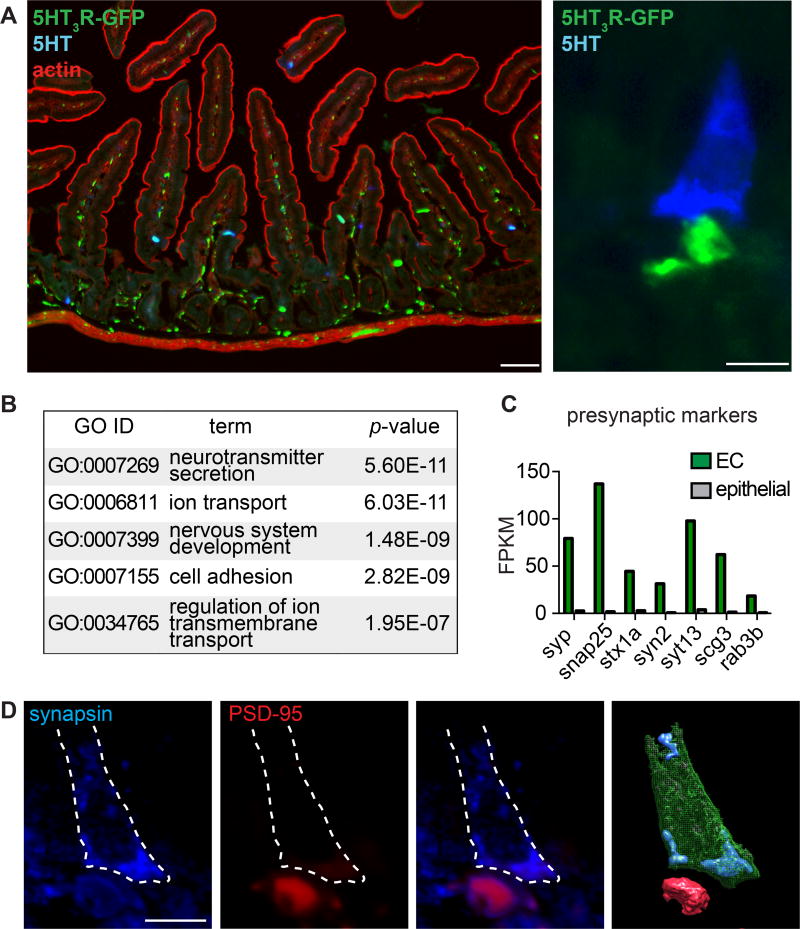
Figure 5. Enterochromaffin cells form synaptic-like contacts with 5HT3R-expressing nerve fibers.
A. (Left) Representative jejunal cryosection showing 5HT3R-expressing fibers (green) innervating intestinal villi near serotonin-expressing EC cells (5-HT, blue) with actin staining (red) to demonstrate intestinal architecture. Scale bar: 50 µm. (Right) Representative image demonstrating proximity between a 5-HT-positive EC cell (blue) and 5HT3R-expressing fiber (green, baslateral side). Scale bar: 10µm.
B. Top 5 enriched Gene ontology (GO) categories in EC cells compared with other intestinal epithelial cells.
C. Presynaptic marker mRNA expression profile in EC cells (green) versus other intestinal epithelial cells (grey). Bars represent fragments per kilobase of exon per million fragments mapped (FPKM).
D. A 5 µm section of intestinal epithelium showing a representative EC cell that expressed the presynaptic marker synapsin (blue, basolateral side) and made contact with a postsynaptic marker-positive fiber (PSD-95, red). Cell body is outlined (dashed white line). Three-dimensional rendering of EC cell (green) with synapsin-positive vesicles (blue) near postsynaptic-like structure (red). Scale bar: 10µm.

