
Fig. 1.
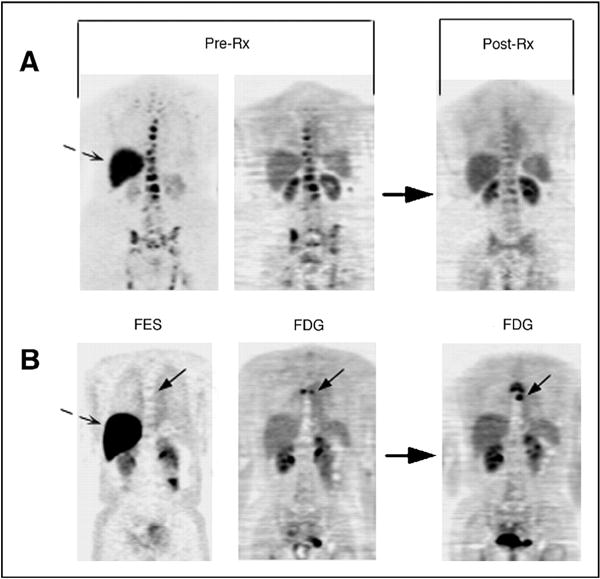
FES-PET used to predict response to hormonal therapy in metastatic breast cancer patients. Pretreatment FES-PET (FES; left) and FDG-PET (FDG; middle) scans and follow-up FDG-PET post-therapy (FDG; right) scan are shown. Bone metastasis with robust FES and FDG uptake (A; top) demonstrates response at 3 months. Bone metastasis (solid arrow) without FES uptake, but with FDG uptake (B; bottom), demonstrates progressive disease at 6 months. Dashed arrows show normal liver FES uptake. Rx, treatment. FDG images are displayed on a consistent SUV scale for each patient pre- and post-therapy. FES is displayed on a scale of 0–5. (Originally published by the American Society of Clinical Oncology [33]).