
Fig. 2.
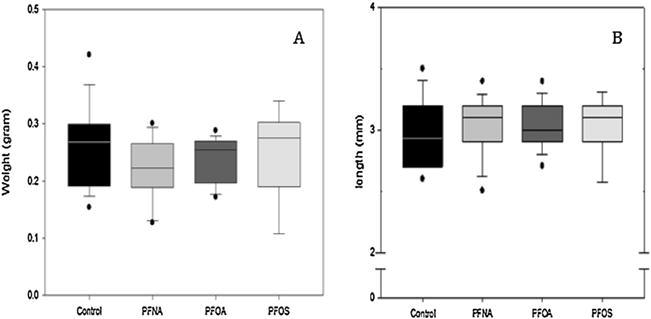
Morphometric measurements of adult zebrafish following acute, embryonic exposure (2.0μM). Box plots represent median ± 25th/75th percentile. Dots indicate the 5th/9th percentile. No significant difference in weight (A) or length (B) were observed for any treatment group. N = 10 fish per treatment group. Statistical significance was tested using a one-way ANOVA, p < 0.05.