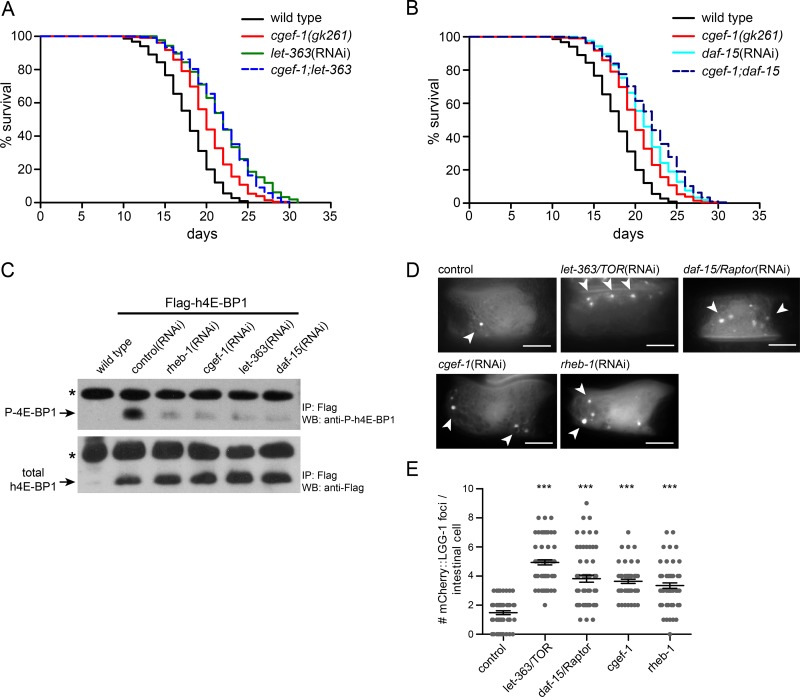
Figure 2. cgef-1 functions in the mTORC1 signaling pathway.
(A) Longevity of let-363/CeTOR(RNAi) was not affected by the cgef-1(gk261) mutation. (B) Survival of daf-15/Raptor(RNAi) was not altered by cgef-1(gk261) mutation. For lifespan analysis (in A and B) cgef-1(gk261) and wild-type N2 worms were fed with let-363/CeTOR, daf-15/Raptor, or control(RNAi). Survival plots represent the combined data from three experiments. See Table 1 for statistical analyses. (C) CGEF-1 activates mTORC1 to phosphorylate the elongation factor 4E-BP1. Phosphorylation of transgenically expressed human 4E-BP1 was used to assess the activity of mTORC1 signaling. Worms carrying the Pges-1::Flag-h4E-BP1 transgene were subjected to RNAi treatment as indicated. After immunoprecipitation (IP) with anti-Flag antibody the Flag-tagged h4E-BP1 was detected by western blot (WB) analysis (lower panel). Phosphorylation of h4E-BP1 was analyzed using anti-P-4E-BP antibody (upper panel). Star indicates antibody light chains. (D) Autophagy is increased after cgef-1 and mTORC1-pathway gene knockdown. Representative pictures of L4 animals expressing mCherry::LGG-1 in the intestine. In control animals mCherry::LGG-1 is diffusely distributed in the cytosol. After inhibition of cgef-1, rheb-1, let-363/CeTOR, and daf-15/Raptor by RNAi an induction of mCherry::LGG-1-positive foci was observed (arrowheads). Scale bar represents 10 μm. (E) Quantification of mCherry::LGG-1 foci in intestinal cells in L4 larvae. Individual data points are plotted to illustrate variability. Bars indicate the mean and SEM for each genotype. n > 25 animals per each condition. ***p < 0.001 versus control, ANOVA.

