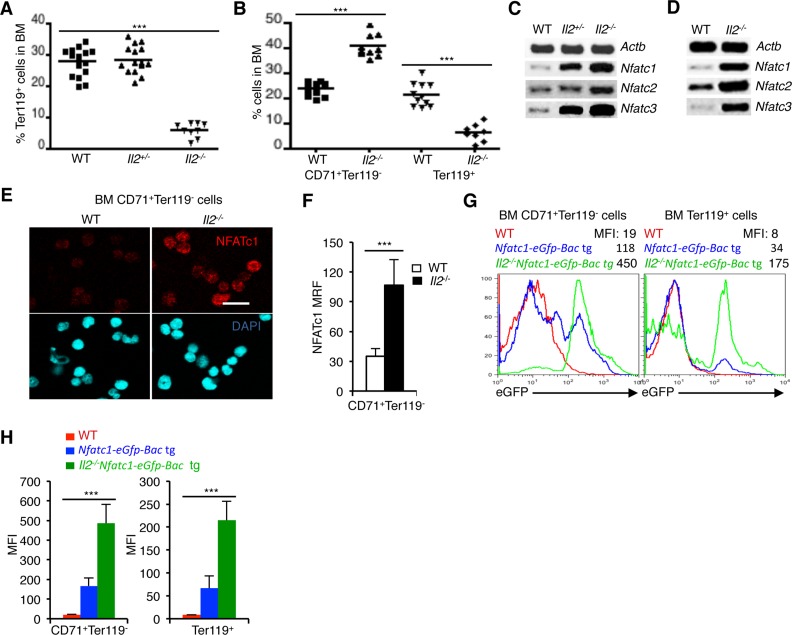
Figure 1. NFAT expression in erythrocytes.
(A) Distribution of Ter119+ cells in the BM of Il2−/− mice compared to WT and Il2+/- littermate controls. (B) Distribution of CD71+Ter119- and Ter119+ (CD71+Ter119+ + CD71-Ter119+) erythrocyte precursor cells in the BM of WT and Il2−/− mice. (C) Expression levels of Nfatc1, Nfatc2 and Nfatc3 mRNA in total BM cells from indicated mice. (D) Nfatc1, Nfatc2 and Nfatc3 gene expression in isolated BM Ter119+ cells from WT and Il2−/− mice. (E) Immunofluorescence analysis of NFATc1 levels in sorted BM CD71+Ter119- cells from WT and Il2−/− mice. DAPI fluorescence indicates nuclear staining. Scale bar, 10 μm. (F) Quantification of NFATc1 mean relative fluorescence (MRF) in BM CD71+Ter119- cells from WT (n = 52) and Il2−/− (n = 42) mice. (G) GFP expression levels in BM CD71+Ter119- and Ter119+ (CD71+Ter119+ + CD71-Ter119+) cells from Il2−/−Nfatc1-eGfp-Bac tg reporter mice compared to WT and Nfatc1-eGfp-Bac tg mice. (H) Quantification of GFP expression levels in BM CD71+Ter119- and Ter119+ (CD71+Ter119+ + CD71-Ter119+) cells from indicated mice. Data in A and B are cumulative of multiple experiments, and in C-G are representative of 3 independent experiments, (n = 4 per group). In (A, B and F) ***p < 0.0001 and in (H) ***p = 0.0004 or 0.0006, one-way ANOVA and unpaired t-test.

