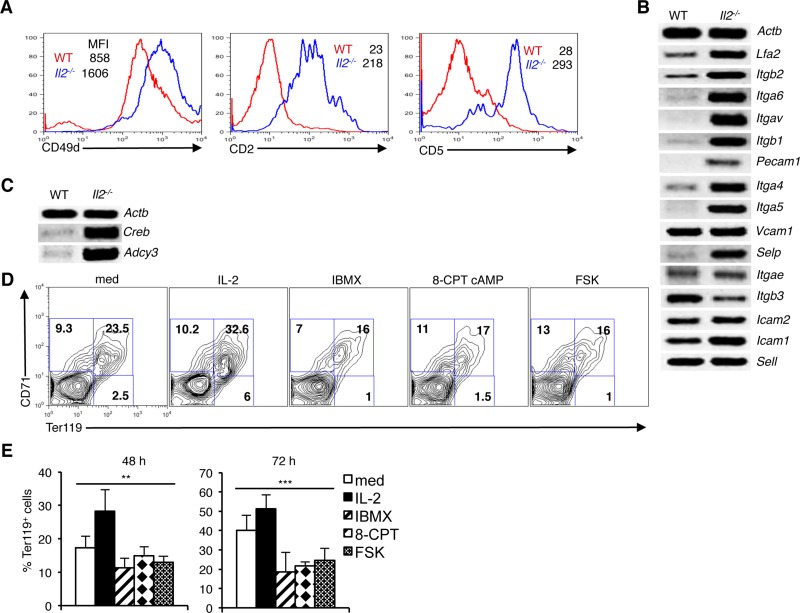
Figure 2. Integrin-cAMP signals influence erythrocyte differentiation.
(A) Expression levels of CD49d, CD2 and CD5 on Ter119+ erythroid cells from WT and Il2−/− mice. (B) Level of mRNA expression of various integrins in Il2−/− Ter119+ cells compared to WT mice. (C) Expression of cAMP signaling-related genes Adcy3 and Creb in Il2−/− Ter119+ cells compared to that in WT mice. (D) Distribution of erythroid cells based on CD71 and Ter119 expression in WT BM cells cultured for 48 h either in medium only or in the presence of IL-2, IBMX, 8-CPT-cAMP or Forskolin (FSK). (E) Quantification of Ter119+ cells at 48 and 72 h of WT BM cell culture in the absence or presence of IL-2, IBMX, 8-CPT-cAMP or FSK. Data in (A–C) are representative of three and in (D and E) are representative of two independent experiments. Numbers inside the histograms in (A) represent mean fluorescence intensity (MFI) and numbers inside each FACS plot in (D) represent percent respective populations. Data in (E) are presented as mean ± s.d., **p = 0.0019, ***p = 0.001, one-way ANOVA.

