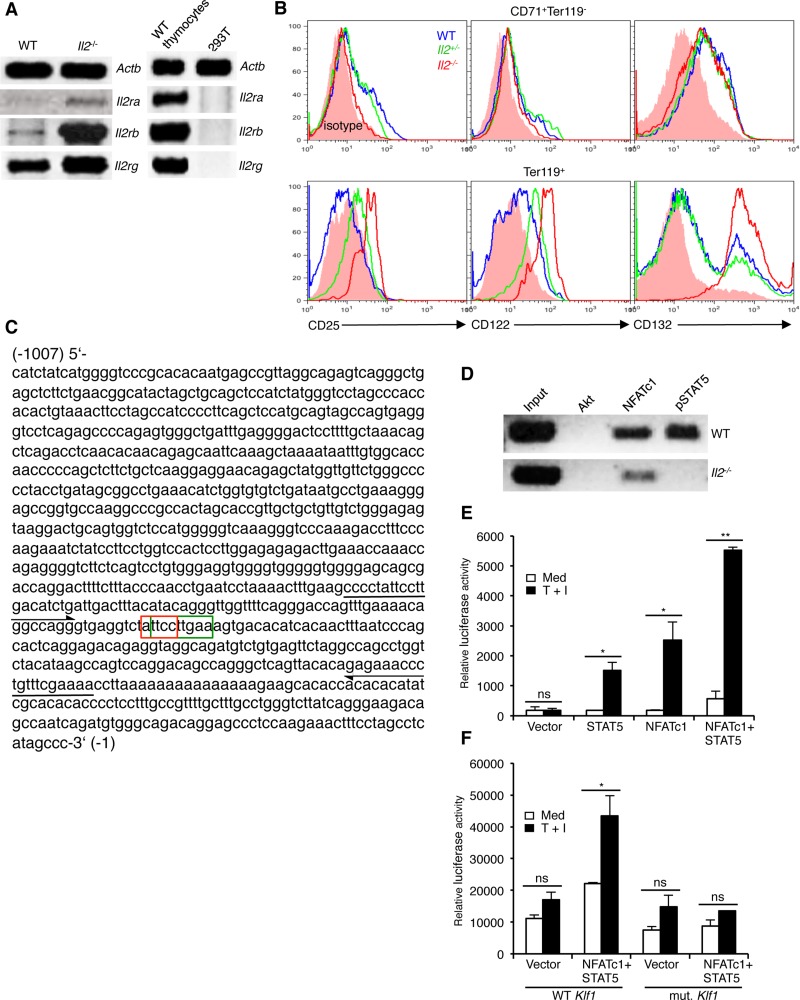
Figure 3. Impaired NFATc1 and STAT5 binding at Klf1 promoter in Il2−/− erythrocytes.
(A) Expression of Il2ra, Il2rb and Il2rg genes in Il2−/− Ter119+ cells compared to WT cells. WT thymocytes and 293T cells were used as positive and negative controls respectively. (B) Intracellular expression of CD25 (IL-2Rα), CD122 (IL-2Rβ) and CD132 (IL-2Rγ) in BM CD71+Ter119- and Ter119+ (CD71+Ter119+ + CD71-Ter119+) cells from WT and Il2−/− mice. (C) Nucleotide sequence of 1kb DNA element upstream of the transcriptional start site containing the Klf1 gene promoter. The composite NFATc1 (3′-CCTTA-5′: red boxed) and STAT5 (5′-TTCNNNGAA-3′: green boxed) binding sites are indicated. Arrows in 5′ and 3′ directions indicate the region amplified in ChIP assays for NFATc1 and STAT5 binding to Klf1 promoter. (D) ChIP analysis for NFATc1 and STAT5 binding at the Klf1 promoter region as indicated in (C) in isolated Ter119+ cells from WT and Il2−/− mice. ChIP with Akt Abs was used as a negative control. (E) Luciferase reporter assay depicting the influence of NFATc1 and STAT5 on Klf1 promoter activity in unstimulated or TPA + Ionomycin (T + I) stimulated 293 HEK cells. (F) Effect of NFATc1 and STAT5 on mutant Klf1 promoter (TT-GA) activity in unstimulated or TPA + Ionomycin (T + I) stimulated 293 HEK cells. Data in (A, B, E and F) are representative of three, and in (D) are representative of two independent experiments. Data in (E and F) are presented as mean ± s.d., ns = not significant, and in (E) *p = 0.0178 or 0.0333 and **p = 0.0016, and in (F) *p = 0.0415, paired t-test.

