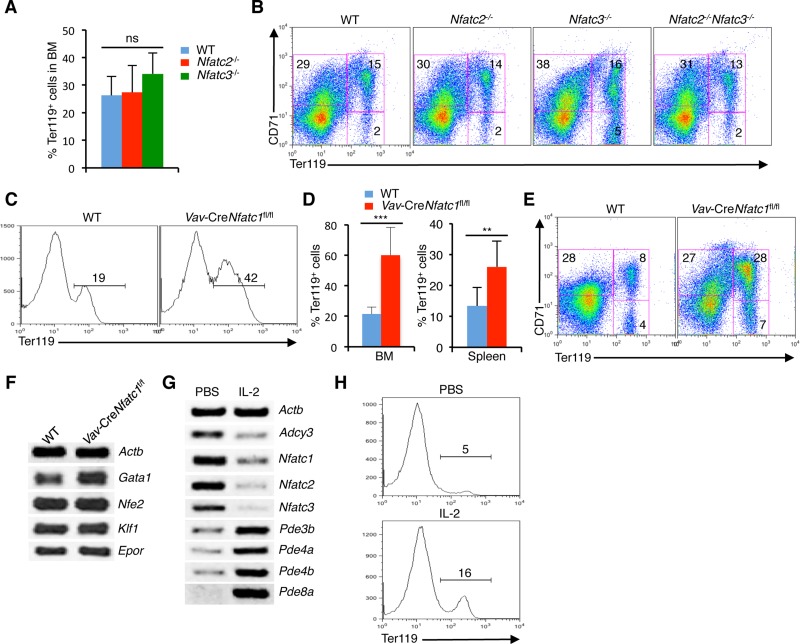
Figure 5. Reduction in NFATc1 activity facilitates erythropoiesis.
(A) Quantification of BM Ter119+ cells in Nfatc2−/− and Nfatc3−/− mice compared to littermate control mice. (B) Distribution of erythroid cells based on CD71 and Ter119 expression in the BM of Nfatc2−/−, Nfatc3−/− and Nfatc2−/−Nfatc3−/− mice compared to WT mice. (C) Ter119+ cells distribution in the BM of Vav-CreNfatc1fl/fl mice compared to littermate control mice. (D) Quantification of percent Ter119+ cells in BM and spleen of Vav-CreNfatc1fl/fl mice compared to littermate WT mice. (E) Erythrocyte differentiation profile based on CD71 and Ter119 expression in the spleen of Vav-CreNfatc1fl/fl mice compared to WT littermates. (F) Expression of Gata1, Nfe2, Klf1 and Epor genes in BM Ter119+ cells from WT and Vav-CreNfatc1fl/fl mice. (G) Nfat and cAMP signaling-related genes expression in BM Ter119+ cells from PBS or IL-2 treated Il2−/− mice. (H) Distribution of Ter119+ cells in the BM of PBS or IL-2 treated Il2−/− mice. Data in (A–H) are representative of three or more independent experiments. Numbers inside each FACS plot represent percent respective populations. Data in (A and D) are presented as mean ± s.d., ns = not significant, in (D) **p = 0.0063 and ***p < 0.0001, one-way ANOVA and paired t-test.

