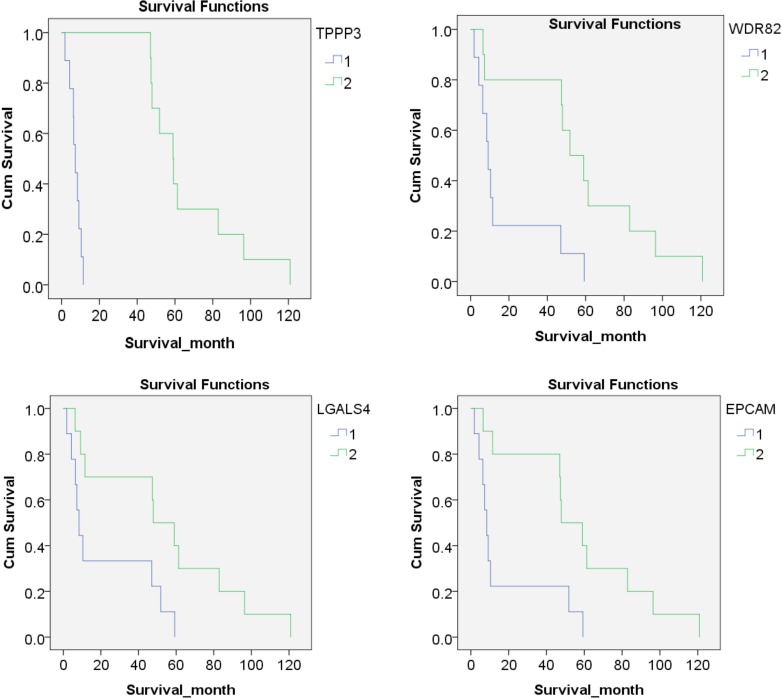
Figure 8. Kaplan-Meier analysis of protein expression.
According to the expression of each protein, patients were divided into two groups: lower expression (9 cases, Blue line, marked by 1) and higher expression (10 cases, green line, marked by 2), Kaplan-Meier analysis showed that four proteins were significantly correlated to the survival months (TPPP3, WDR82, LGALS4 and EPCAM, P values were < 0.001, 0.008, 0.020 and 0.010, respectively).

