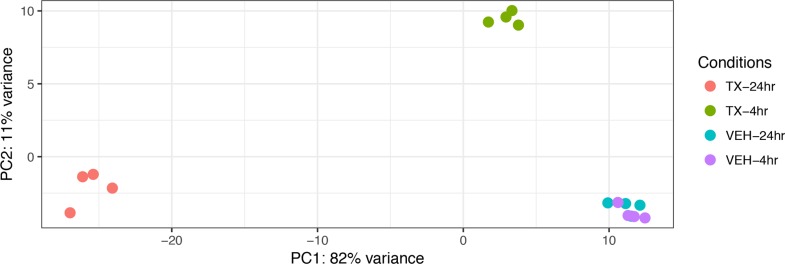
Figure 2. A Principal Components Analysis (PCA) of gene expression data from vehicle treated and drug (3 µM HCI-2509) treated NGP cells at 4 hours and 24 hours to assess early and late gene expression change.
Each time point and treatment condition had four biological replicates. PC = Principal component. The Euclidean distance between the gene expression profiles of each treatment condition is measured using the variance of stabilized, normalized counts for all genes. The higher the PC number, the more different two samples are from each other. The gene expression of the vehicle treated samples at 4 hours and 24 hours (VEH-4 hr, VEH-24 hr) clusters close together with minimal variance. PC1 contains the most variability, PC2 contains the second most variability. The gene expression of the 24 hour treated samples (TX-24 hr) is driving PC1 and the gene expression of the 4 hour treated samples (TX-4 hr) is driving PC2, which is stronger.

