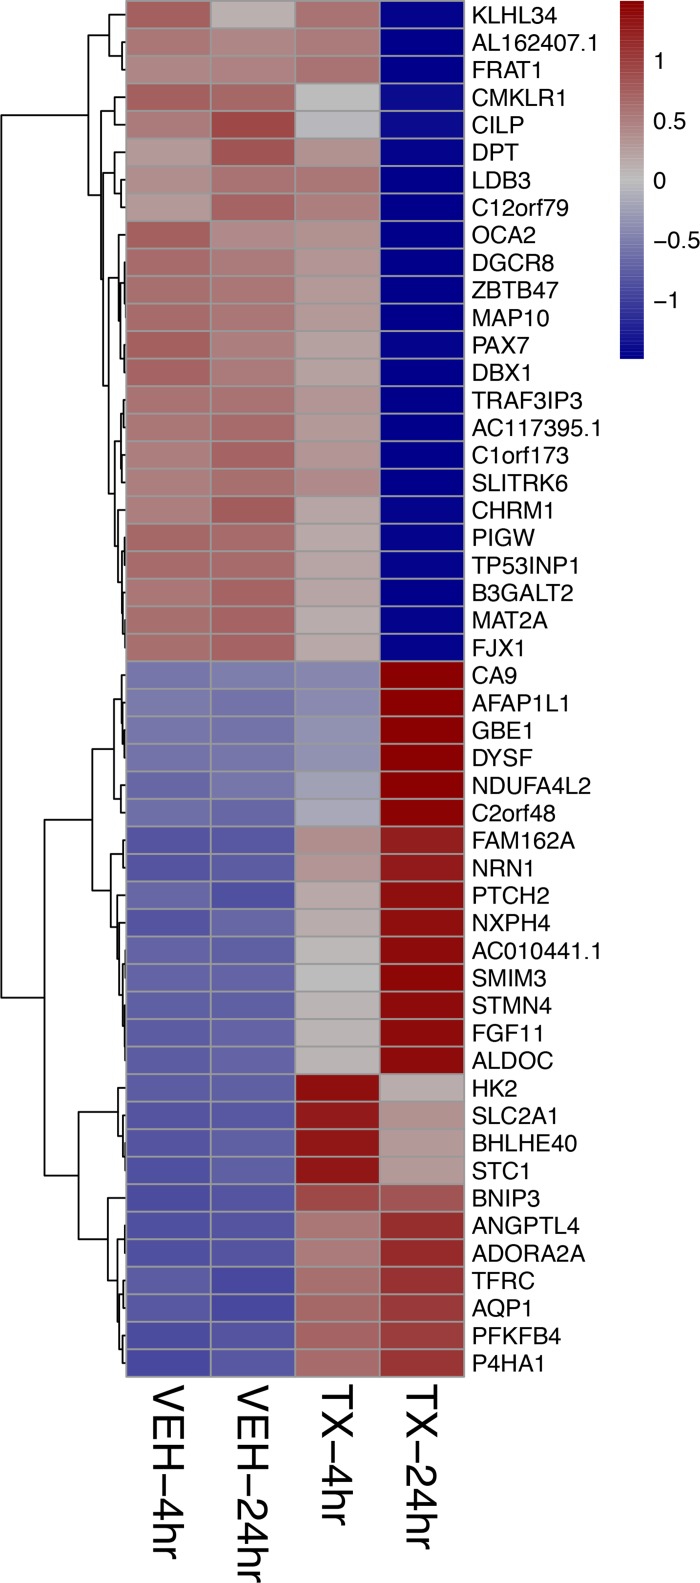
Figure 3. Heat map showing the top 50 of all protein coding genes affected by HCI-2509 at 4 and 24 hours of treatment.
The strongest log2-fold change of all protein coding genes across either time point (4, 24 hours) post treatment of NGP cells with HCI-2509 as compared to vehicle.TX-24 hr = treatment with 3 µM of HCI-2509 for 24 hours, VEH-4hr = vehicle treatment for 4 hours The genes are ordered by fold change.

