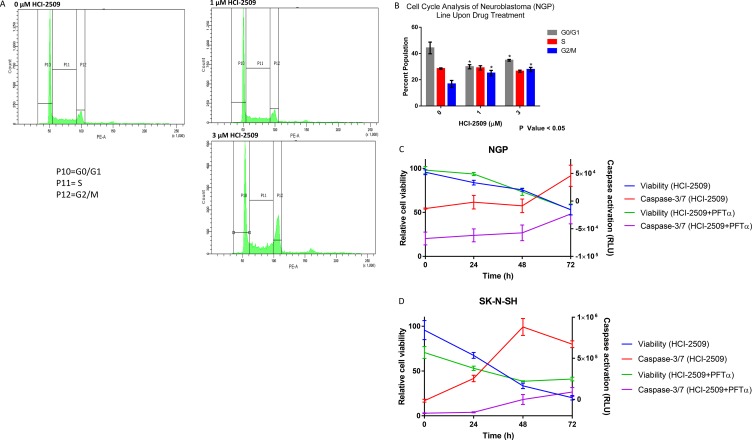
Figure 9. Cell cycle and viability changes and caspase activation with HCI-2509.
(A) Cell cycle changes by flow cytometry in NGP cells were assessed at 24 hours after treatment with 0, 1 and 3 µM of HCI-2509. (B) GraphPad Prism was used to analyze the difference in the percent cell populations in the three phases of the cell cycle in untreated and treated samples. The change in the cell population distribution was replicated for a total of three times. An unpaired student t-test to compare the percent population with and without treatment showed the change in G0/G1 and G2/M populations to be statistically significant with treatment resulting in a decrease in the G0/G1 phase and increase in G2/M phase with p-value less than 0.05. (C) NGP cells treated with 3 µM HCI-2509 at 0, 24, 48 and 72 hours were assessed for viability and caspase activation by CellTiter-Glo and Caspase-Glo 3/7 assays, normalized to vehicle control and plotted as a function of time. Cells pretreated with PFTα were similarly treated and assessed. The error bars represent biological replicates.(D) SK-N-SH cells were similarly assessed for viability and caspase 3/7 activation with HCI-2509 at 0, 24 and 48 hours in the presence and absence of PFTα. The error bars represent biological replicates.

