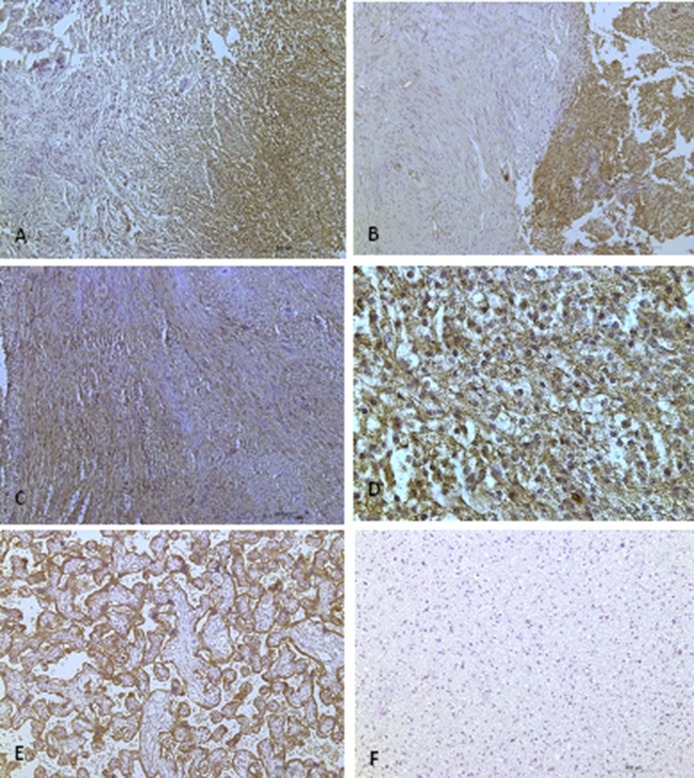
Figure 4. CXCR4 protein expression in vestibular schwannomas.
(A and B) Antoni type A regions show weak staining, while Antoni type B regions are strongly stained. (A) is a sporadic vestibular schwannoma, and (B) is an NF2-associated vestibular schwannoma. (C) There is strong staining in Antoni type A regions. (D) 40X magnification reveals CXCR4 protein expression at the cell membrane (scale bar, 50 µm). (E) Placental tissue served as a positive control and (F) astrocytoma tissue was used as a negative control. (A–C, E, F): Scale bar, 200 μm.

