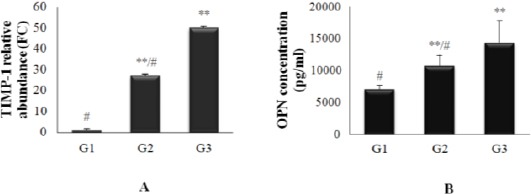
Figure 1.

(A) TIMP-1 relative expression level (FC ± S.D). (B) Osteopontin concentrations (Mean ± S.D) in control and different tested groups. **Highly significant different with the control group G1 (p ≤ 0.001), # Highly significant different with cardiovascular, diabetic group G4
