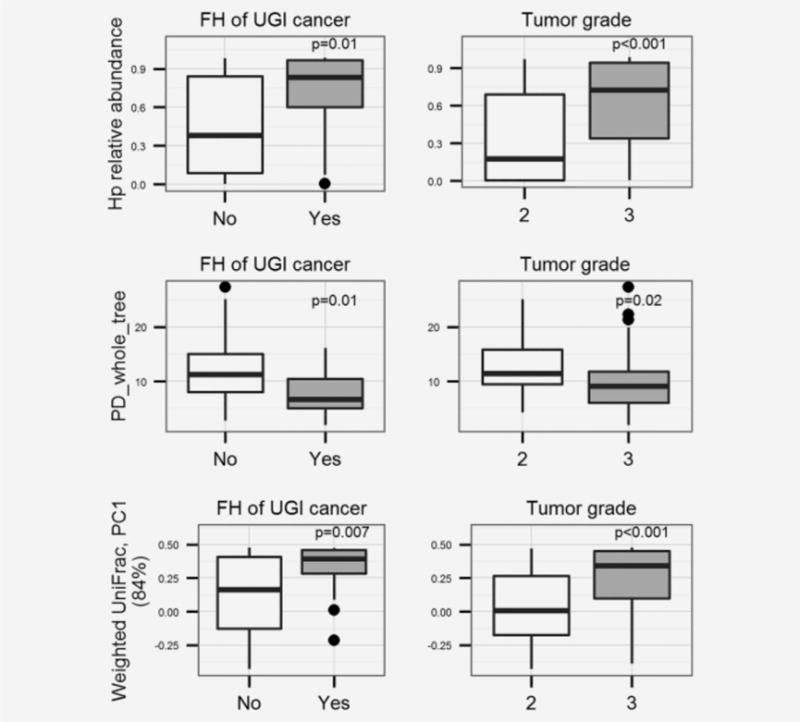
Figure 1.

Non-malignant gastric tissue microbiota features associated with family history (FH) of UGI cancer and tumor grade, P values were based on Wilcoxon rank-sum tests. (a, b, c), comparison of Hp relative abundance, PD_whole_tree (an alpha diversity measurement) and first principal component (PC1, explain 84% variance) of unweighted UniFrac (a beta diversity measurement) by family history of UGI cancer. (d, e, f), comparison of Hp relative abundance, PD_whole_tree, and PC1 of unweighted UniFrac by tumor grade. The Boxes are interquartile range (IQR); median values are bands within the boxes; the lines outside the boxes are 1.5-times IQR. The dots are outliers.
