
Figure 3. MYB and MYBL1 gene expression levels in breast adenoid cystic carcinomas (AdCCs) defined by RT-qPCR and RNA-sequencing.
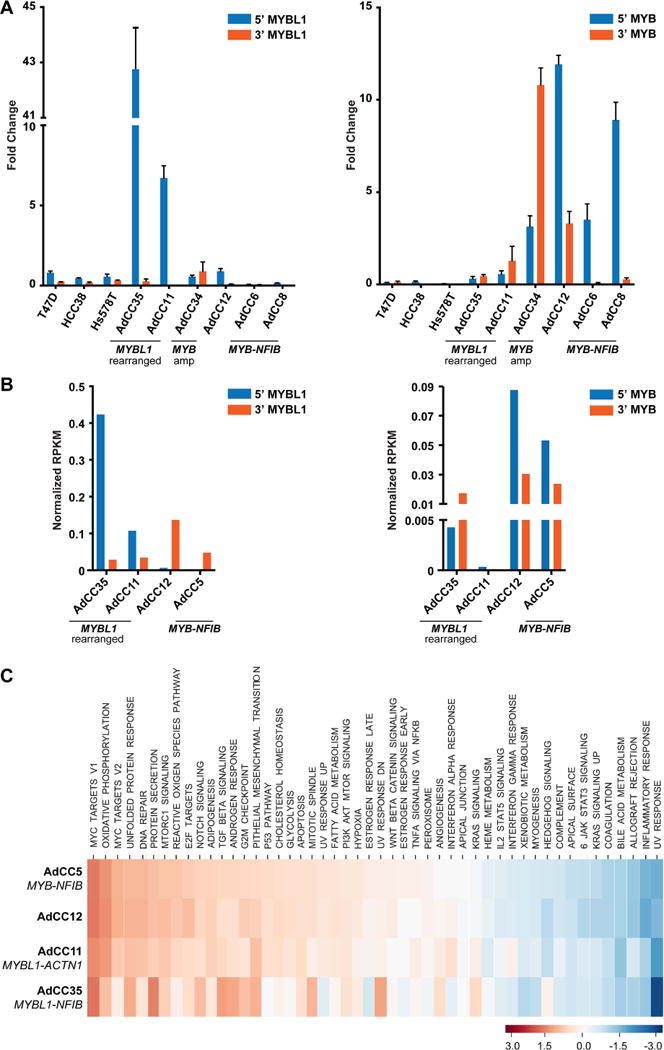
(A, B) The gene expression levels of the 5′ and 3′ portions of the MYBL1 (left) and MYB (right) transcripts in four MYB-NFIB-negative breast AdCCs are compared to those of AdCCs previously documented to harbor the MYB-NFIB fusion gene (AdCC5, AdCC6 and/or AdCC8) [1,3] and/or three breast cancer cell lines (T47D, HCC38 and Hs578T), as defined by RT-qPCR (A), error bars, SD of mean (n = 3 experimental replicates); (B), RNA-sequencing using normalized RPKM values). (C) Single sample gene set enrichment analysis (ssGSEA) was performed to assess pathways activated in the four breast AdCCs analyzed by RNA-sequencing. The calculated enrichment score (ES) for each pathway in each case is illustrated, where each column represents a case and each line represents a pathway. For comparison, the MYB-NFIB-positive AdCC5 [3] was included. Amp, amplification, RPKM, reads per kilobase per million mapped reads. ssGSEA, single-sample gene set enrichment analysis.