
Figure 3.
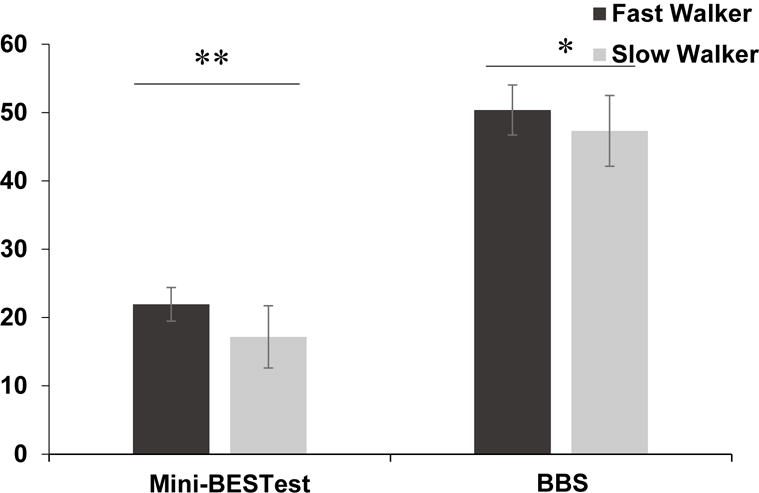
ndependent sample t-tests demonstrated significant differences between the Fast Walkers (FW) and Slow Walkers (SW)) for the Mini-BESTest and BBS. Bars are means and error bars are standard deviations. (*) represents p ≤ 0.05; (**) represents p ≤ 0.01.