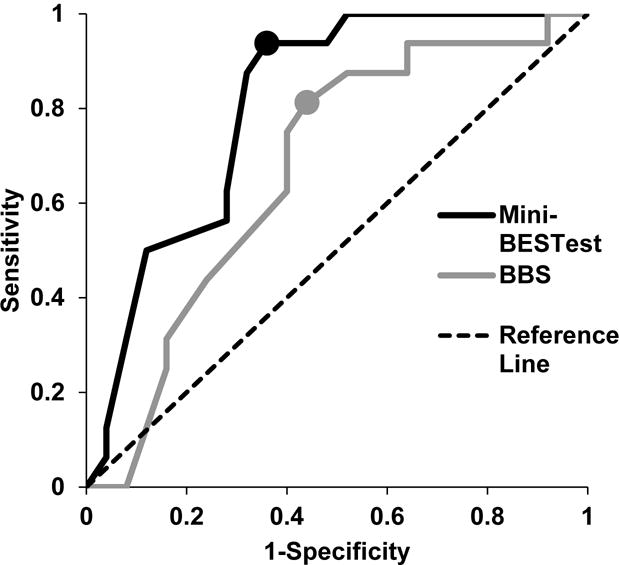
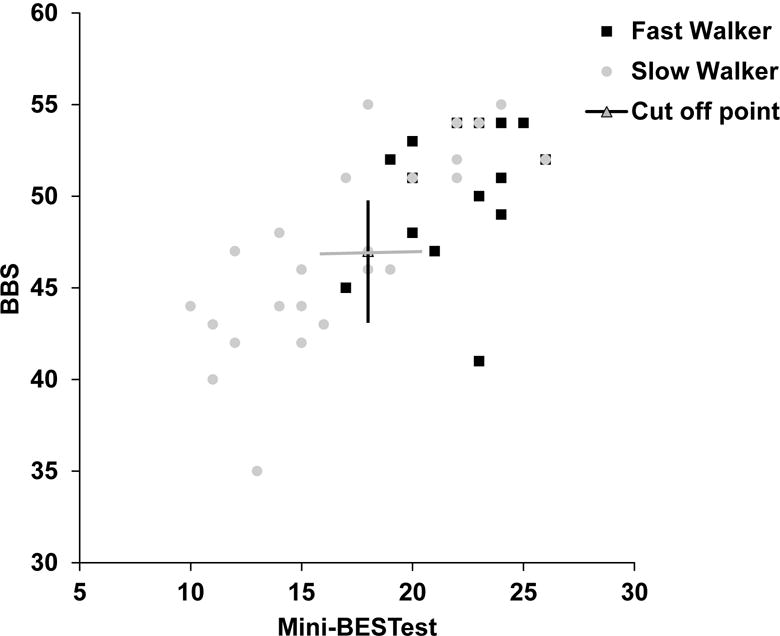
Figure 4.


(4A) Receiver operating characteristic curves of the Mini-BESTest (black line) and BBS (gray line) for classifying participants into fast and slow walkers. The filled circles indicate the cut-off points for differentiating participants into fast and slow walkers based on their self-selected gait speeds. (4B) Scatter plot of Mini-BESTest and BBS for fast and slow walkers. The gray circles denotes slow walkers and filled squares depict fast walkers. The cut-off points for the Mini-BESTest and BBS are represented by black vertical and gray horizontal lines respectively.
