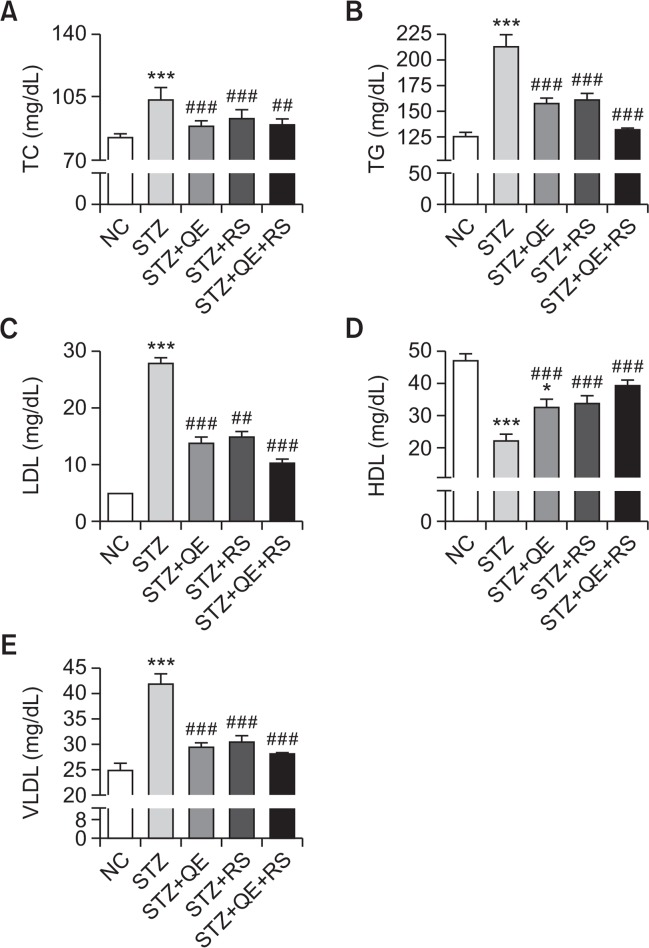
Fig. 4.
Effects of quercetin (QE), resveratrol (RS), and their cotreatment on serum lipid profiles. Rats were equally divided into each group (n=10 per group). Data are means ± standard error of the mean (SEM). Groups: NC, normal control; STZ, streptozotocin-treated diabetic; STZ+QE, QE-treated STZ-diabetic rats; STZ+RS, RS-treated STZ diabetic rats; STZ+QE+RS, QE and RS-cotreated STZ-treated diabetic rats. Significance was measured using one-way analysis of variance (ANOVA) followed by Bonferroni’s post-hoc test. *p<0.05 and ***p<0.005 vs. NC group; ##p<0.01 and ###p<0.001 vs. STZ-treated group. TC, total cholesterol; TG, triglyceride; HDL, high density lipoprotein; LDL, low density lipoprotein; VLDL, very low density lipoprotein.

