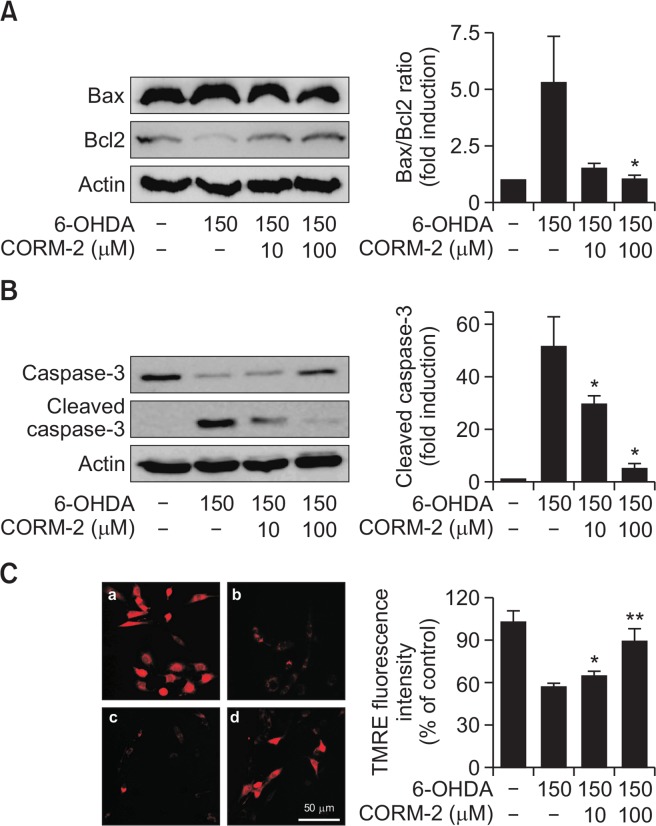
Fig. 2.
Effect of CO on 6-OHDA-induced activation of apoptotic signals in C6 cells Cells were treated with 6-OHDA (150 μM) and CORM-2 (10 μM or 100 μM) for 24 h. (A) Expression of proapoptotic protein, Bax and anti-apoptotic protein. Quantitative data for the relative ratio of Bax to Bcl2 was shown on the right panel. (B) Activation of caspase-3 protein by cleavage. Quantitative data for the expression levels of total and cleaved forms of caspase-3 was shown on the right panel. *p<0.05 compared by 6-OHDA alone group. (C) Alterations in mitochondrial transmembrane potential. The TMRE staining images were acquired by using a fluorescence microscope. (a) control; (b) 6-OHDA (150 μM) alone; (c) 6-OHDA (150 μM)+CORM-2 (10 μM); (d) 6-OHDA (150 μM)+CORM-2 (100 μM). Quantitative fluorescence intensity was shown on the right panel. *p<0.05, **p<0.001 was compared by 6-OHDA alone group.

