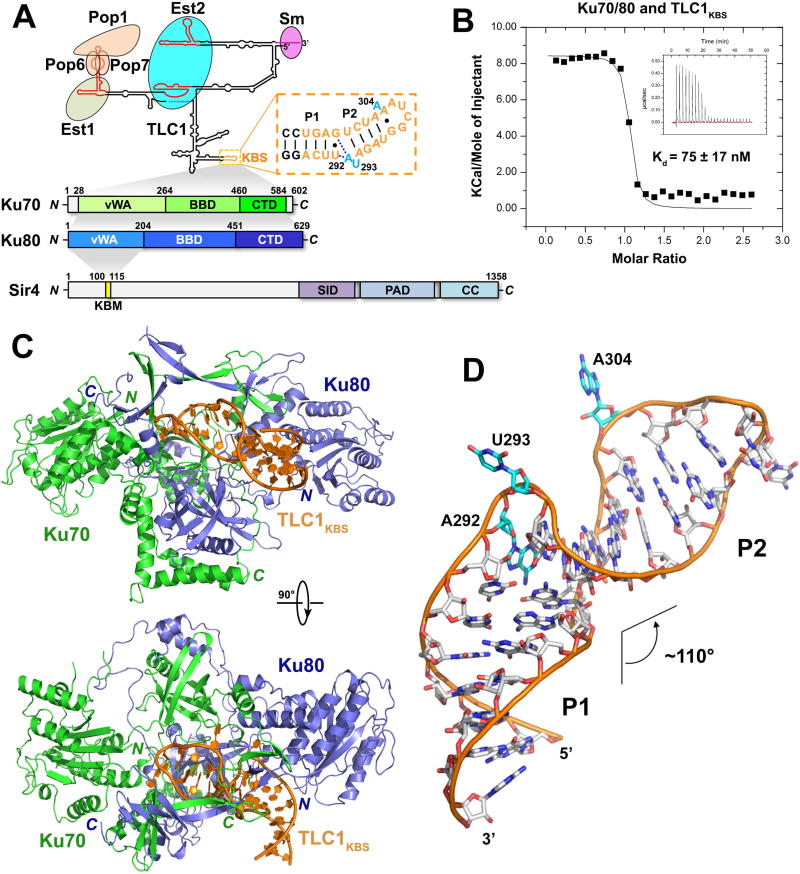
Figure 1. Overview of the Ku-Tlc1KBS Complex Structure.
(A) Domain organization of S. cerevisiae TLC1, Ku70/80, and Sir4. Top: predicted secondary structure of TLC1. Conserved domains, motifs and interacting proteins are designated. TLC1KBS is denoted with a dashed box. Bottom: domain organization of Ku70/80 and Sir4. The shaded areas indicate the interactions of Ku70/80-TLC1, Ku70-Ku80 and Ku80-Sir4, respectively. (SID: Sir2-interacting domain; PAD: partitioning and anchoring domain; CC: coiled coil). (B) ITC measurement of the interaction between Ku70/80 and TLC1KBS. Inset: ITC titration data. (C) Two orthogonal views of the overall structure of the Ku-TLC1KBS complex. Ku70, Ku80 and TLC1KBS are colored in green, slate blue and orange, respectively. (D) Overall conformation of TLC1KBS in the Ku-TLC1KBS complex. The A292U293 and A304 bulges are colored in cyan.
See also Figure S1 and Table S1.

