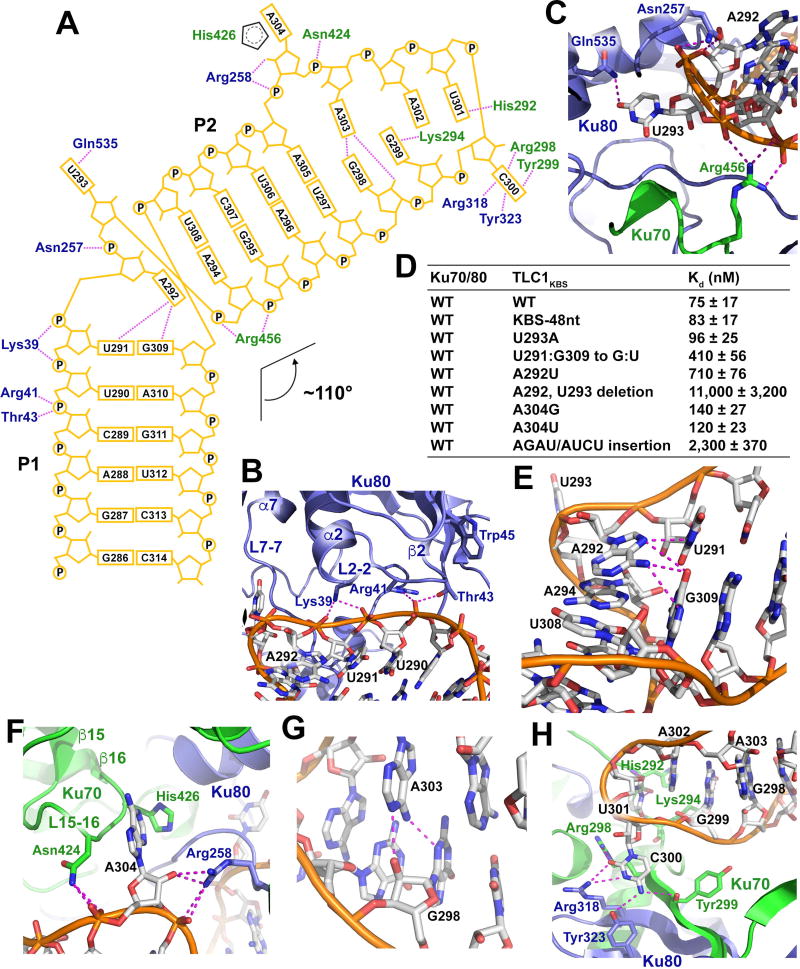
Figure 2. Structural and Mutational Analysis of the Ku-TLC1KBS Interaction.
(A) Schematic diagram of the Ku-TLC1KBS interactions. TLC1KBS is shown in orange. Ku70 and Ku80 residues are shown in green and slate blue, respectively. Hydrogen bonds are denoted as magenta dotted lines. (B) Detailed interactions between the P1 stem backbone of TLC1KBS with Ku80. (C) U293 of TLC1KBS flips out from the RNA into a pocket formed by both Ku70 and Ku80. (D) ITC data of the interactions between Ku70/80 and wild-type and mutant TLC1KBS(E) A292 of TLC1KBS mediates hydrogen-bonding interactions with the U291•G309 pair and stacking interaction with the A294-U308 pair. (F) Detailed interactions of the second bulge at A304 with its surrounding Ku70/80 residues. (G) Hydrogen-bonding interactions in the trans Sugar Edge/Watson-Crick G298•A303 pair. (H) Detailed interactions of the nucleotides G299C300U301A302 with their surrounding Ku residues.
See also Figure S2.

