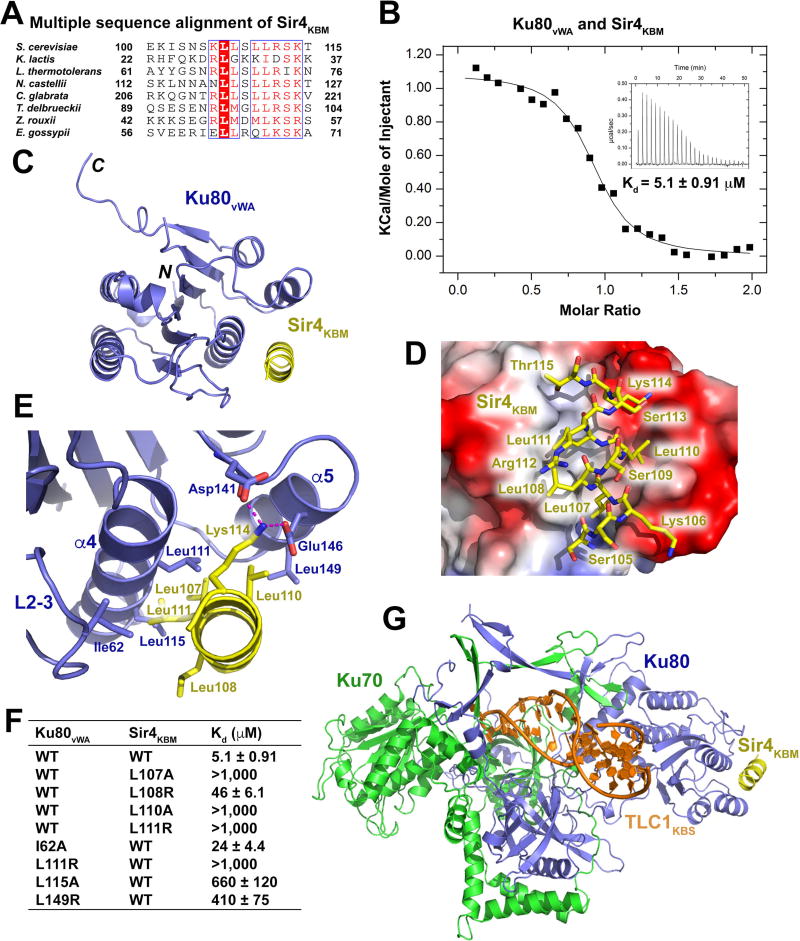
Figure 3. Structural and Mutational Analyses of the Ku80vWA-Sir4KBM Interaction.
(A) Multiple sequence alignment of Sir4KBM. Conserved residues of Sir4KBM are boxed and highlighted in red. (B) ITC measurement of the Ku80vWA-Sir4KBM interaction. Inset, ITC titration data. (C) Overall structure of the Ku80vWA-Sir4KBM complex. Ku80vWA and Sir4KBM are colored in slate blue and yellow, respectively. (D) Electrostatic surface potential of the Sir4KBM binding site of Ku80vWA (positive potential, blue; negative potential, red). Sir4KBM is presented in stick model and colored in yellow. (E) Details of interactions between the Sir4KBM helix and helices α4 and α5 and loop2–3 of Ku80vWA. Hydrogen bonds are denoted as magenta dashed lines. (F) ITC data of wild-type and mutant Ku80vWA-Sir4KBM interactions. (G) Atomic model of the TLC1KBS-Ku70/80-SirKBM complex. TLC1KBS, Ku70, Ku80, and Sir4KBM are colored in orange, green, slate blue, and yellow, respectively.
See also Figure S3 and Table S2.

