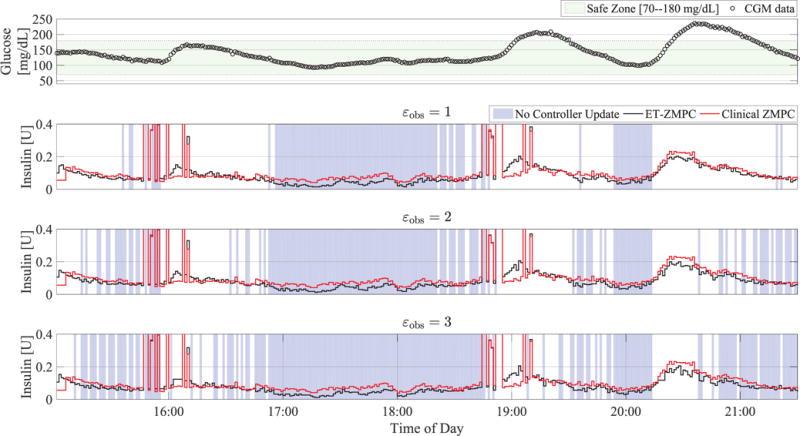
Fig. 8.

Clinical evaluation of ET-ZMPC using advisory mode with varying εobs on clinical data. The lower three plots compare mean insulin profiles of the ET-ZMPC (black) and the clinical controller (red) for 17 patients, where the background blue shading denotes times when the control module processor can be switched off.
