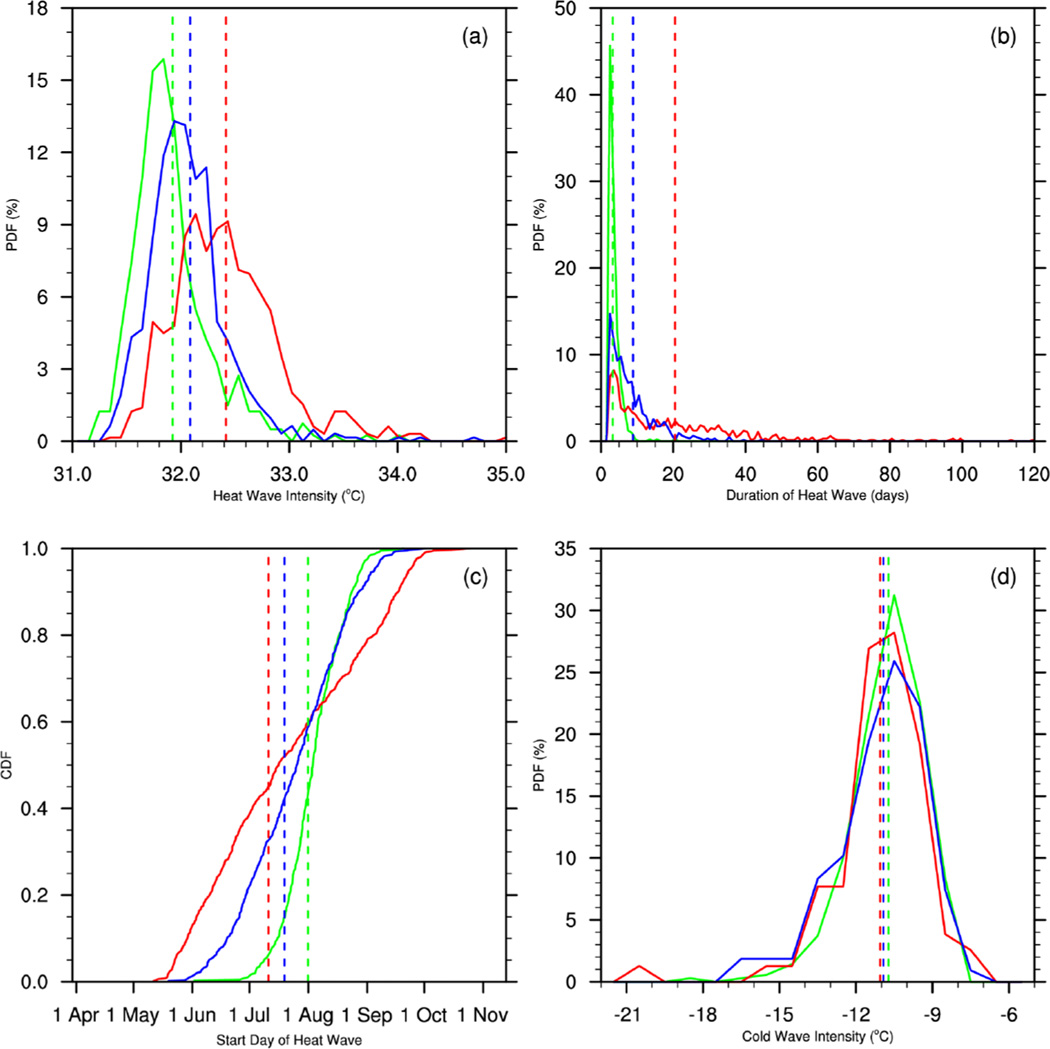
Fig. 4.
Frequency distributions of ensemble mean urban heat/cold wave characteristics for 1981–2005 (green lines), 2061–2080 RCP4.5 (blue lines), 2061–2080 RCP8.5 (red lines). Vertical dashed lines indicate the mean of each distribution. a) intensity of heat waves for urban Houston, Texas, b) as in (a) but for duration of heat waves, c) as in (a) but for cumulative distribution function of starting day of heat waves, d) intensity of cold waves for urban Denver, Colorado.

