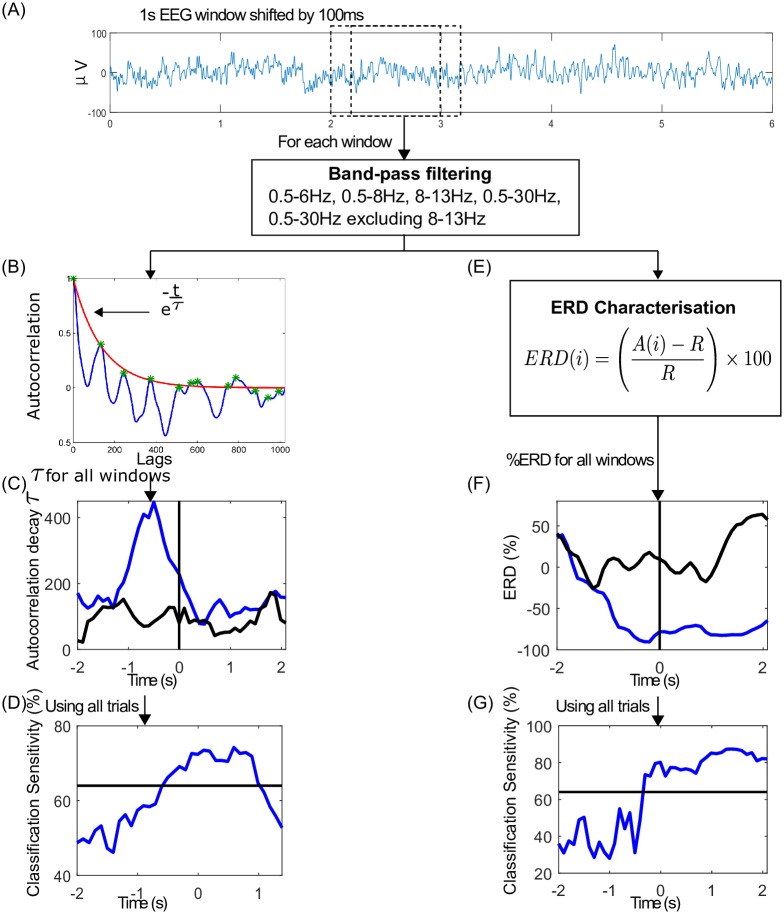
Fig 2. Autocorrelation relaxation time and ERD feature extraction and classification.
(A) 6s EEG trial is divided into 1s windows shifted by 100ms and band-pass filtering is performed for the four different frequency bands. (B) Exponential curve fitting representing the autocorrelation relaxation process on each window. The relaxation time τ was extracted as a feature. (C) Plot of all τ values in a single trial for tap (blue) and resting state (black) (vertical line marks the onset of finger tap at 0s). (D) Classification sensitivities for tap vs. resting state along the length of trial for autocorrelation feature. The horizontal line indicates the classification threshold with statistical significance (p < 0.05). (E) Computation of ERD(%) for each window. (F) Plot of all ERD values in a single trial for tap (blue) and resting state (black) (vertical line marks the onset of finger tap at 0s). (G) Classification sensitivities along the length of trial for tap vs. resting state ERD.

