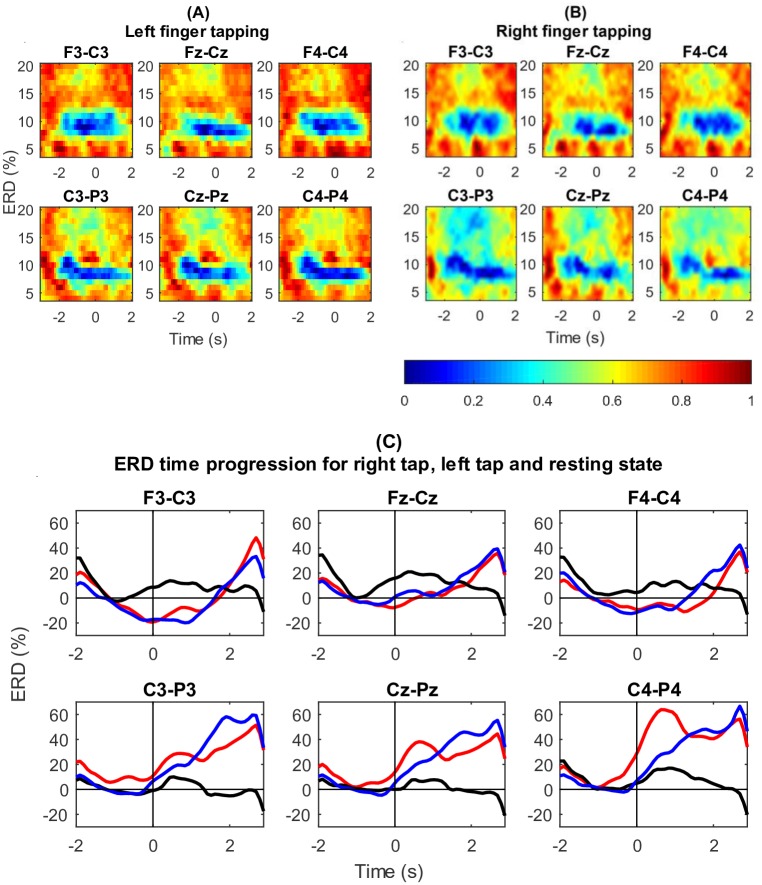
Fig 3. Grand average spectrograms and ERD time progression for six bipolar channels for all the participants.
(A) Left finger tapping grand average spectrogram in six bipolar channels (the onset of finger tap is at 0s). ERD is clearly seen around 10Hz. (B) Right finger tapping grand average spectrogram in six bipolar channels (the onset of finger tap is at 0s). ERD is clearly seen around 10Hz. (C) Grand average ERD time progression for right finger tapping (red), left finger tapping (blue) and resting state (black). Vertical line shows the onset of finger tap at 0s. ERD is seen in right and left hand finger tapping.

