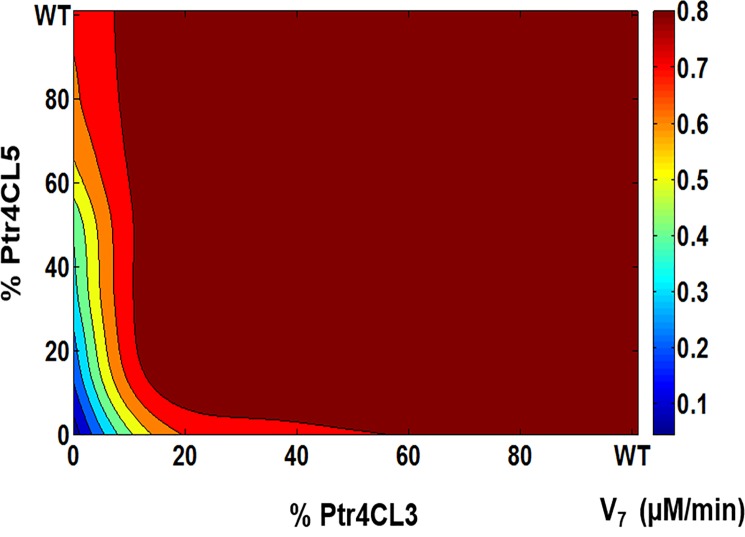
Fig 4. Contour plot showing the variation of steady state flux (V7) as a function of Ptr4CL3 and Ptr4CL5 concentration in the absence of a complex.
The axis values represents the percentage of the protein concentration as a function of the wild type concentration. The color bar represents the flux values (μM/min).

