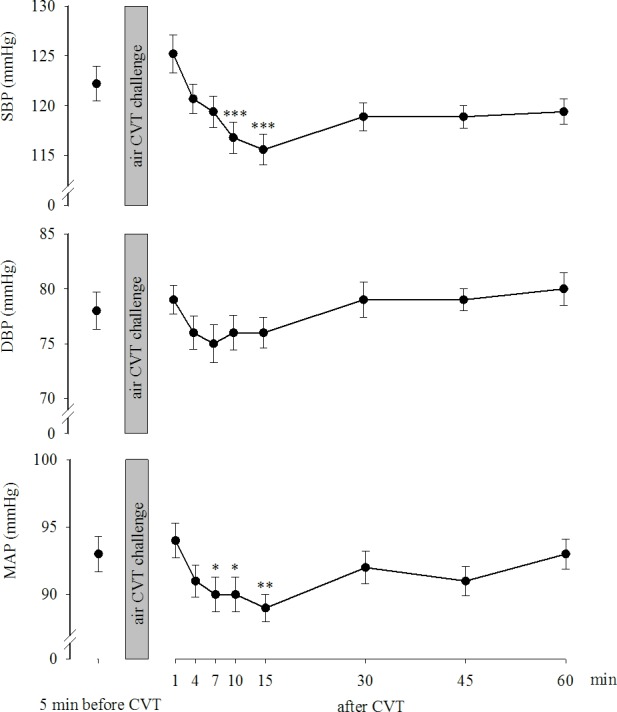
Fig 4. SBP, DBP and MAP before and after the CVT stimulation.

Data are expressed as the mean±SE. *,**,***: p<0.05, p<0.01 and p<0.001, respectively, vs before the CVT.

Data are expressed as the mean±SE. *,**,***: p<0.05, p<0.01 and p<0.001, respectively, vs before the CVT.