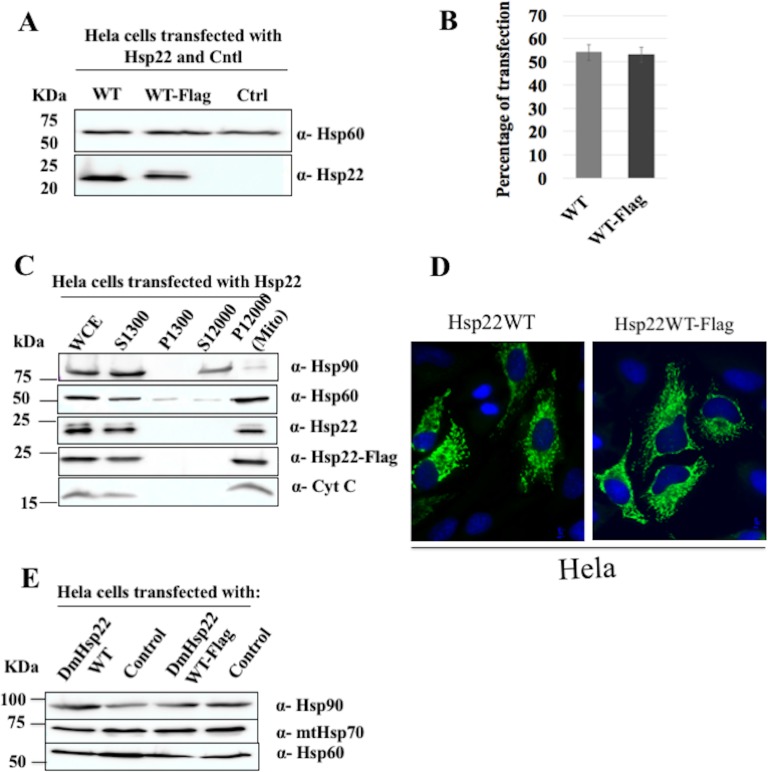
Fig 1. Characterization of DmHsp22WT and DmHsp22WT-Flag expressing cells.
(A) HeLa cells were transfected with 3 μg of DmHsp22WT, WT-Flag and pcDNA as negative control (Ctrl) and 3 μl of lipofectamine as transfection reagent at 1:1 ratio for 24 hours. Cells were lysed with RIPA buffer and western blot was performed. DmHsp22’s expression level was detected in immunoblot probed with anti-DmHsp22 antibody. Anti-Hsp60 was used as loading control (see Materials and Methods). (B) Percentage of transfected cells (% of total cells) was determined 24 hours after transfection using immunofluorescence. Results are shown as a bar graph (P>0.05). Values represent the means ± SD from ten independent experiments. (C) Whole-cell extracts (WCE), cytosolic extracts (S1300 or S12000g), pellets (P1300g) and purified mitochondria fractions (P12000 or Mito) from HeLa cells transfected with DmHsp22WT and WT-Flag. 25 μg of each fraction were analysed by SDS-Page followed by immunoblotting with Anti-Hsp60 and Anti-cytochrome c as mitochondrial markers and anti-Hsp90 as a cytosolic marker. (D) HeLa cells expressing DmHsp22WT and C-terminal Flag-tagged DmHsp22 were processed for immunofluorescence detection of DmHsp22 as described in Materials and Methods. 24 hours post-transfection, fixed and permeabilized cells were stained with anti-Hsp22 antibody followed by Cy2 (green fluorescence) and DAPI (blue fluorescence) for nuclei labelling. Images were obtained using a fluorescence microscope. (E) Expression of DmHsp22WT and WT-Flag did not change levels of Hsp60 and Hsp70 in immunoblots probed with the corresponding antibodies. Anti-Hsp90 was used as loading control.

