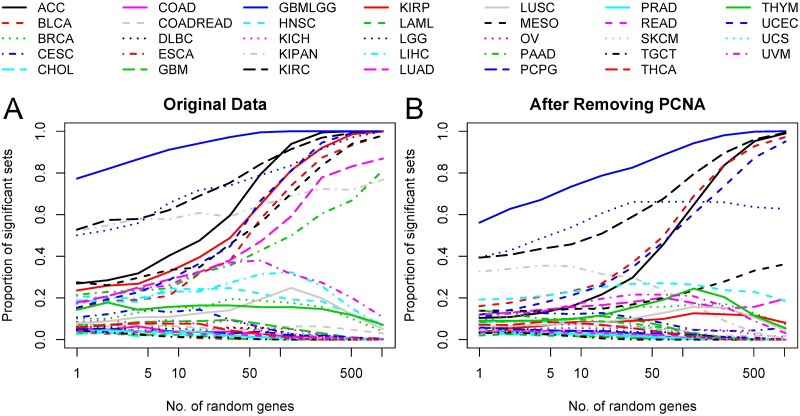
Fig 1. Random bias vs. random set size.
The x axis represents the size of the random gene sets that were chosen, and the y axis represents the proportion of significant sets of that size. A. The results of the analysis using the raw data, and B. The results of the analysis after adjusting for the PCNA meta-gene.

