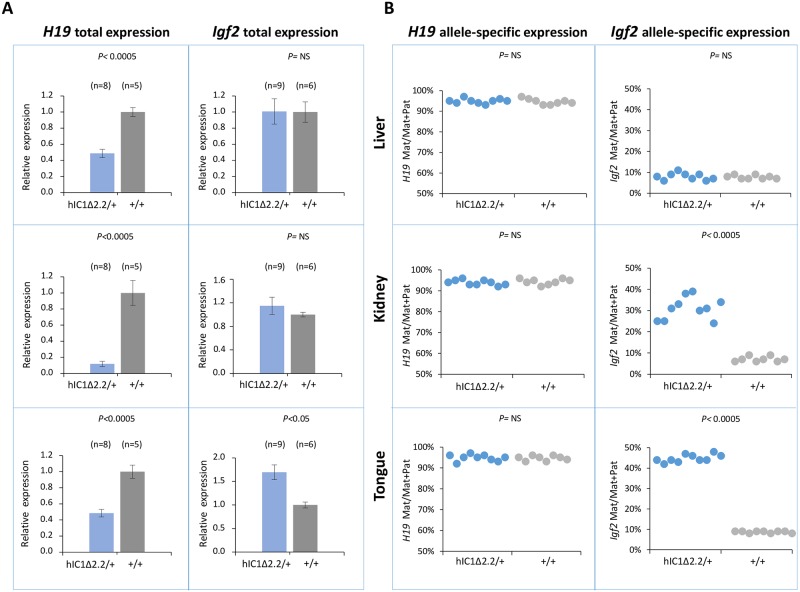
Fig 3. Analysis of H19 and Igf2 expression in H19hIC1Δ2.2/+ newborn mice.
(A) Histograms of total H19 and Igf2 expression in three different neonatal organs of H19hIC1Δ2.2/+ and H19+/+ littermates analysed by RT-qPCR. The mean value of H19+/+ is set arbitrarily as 1. NS, Not Significant. Bars represent the mean ± SEM. (B) Allele-specific expression of H19 and Igf2. Dots indicate the percent expression of the maternal allele in each individual sample. The animals used for this study derived from three litters.

