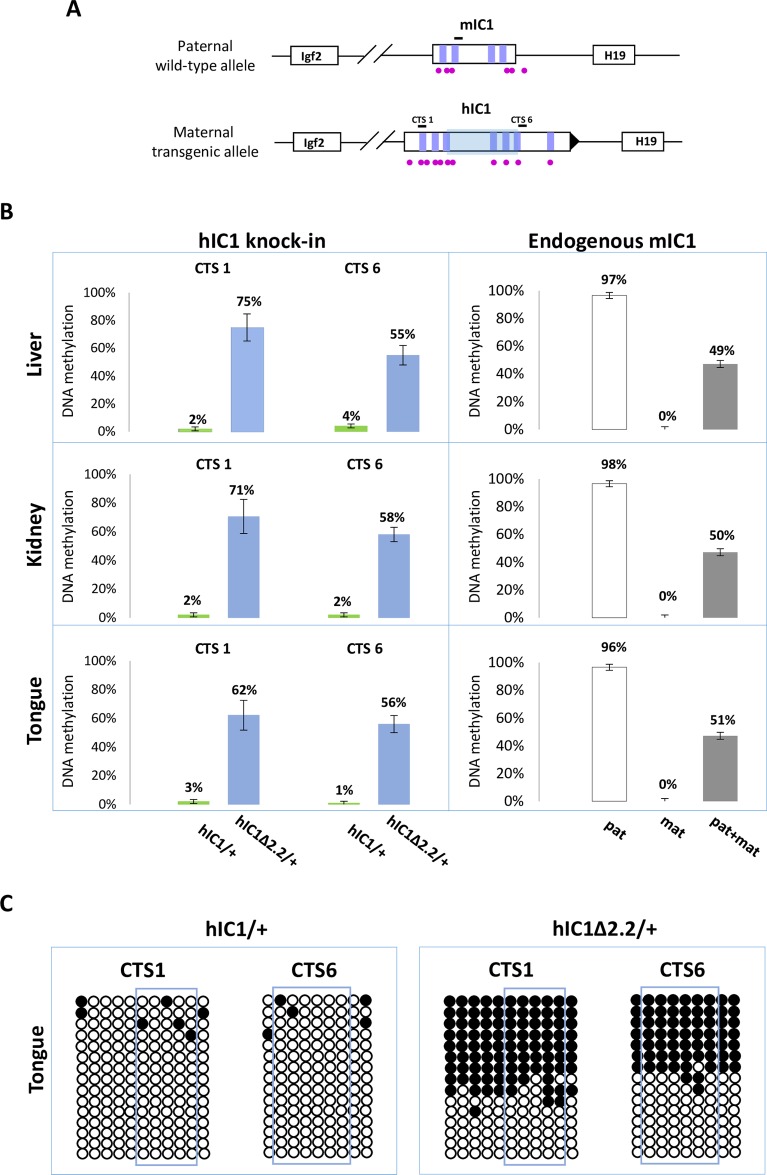
Fig 4. Gain of IC1 methylation in H19hIC1Δ2.2/+ mice.
(A) Graph representing the humanized and endogenous H19/Igf2 locus with the regions (indicated by black bars) whose methylation was analysed by pyrosequencing. The region deleted in H19hIC1Δ2.2 is represented by a shaded light blue box. The coordinates of the sequenced CpGs are: CTS1 in hg39—chr11:2,024,193–2,024,261; CTS6 in hg39—chr11:2,021,096–2,021,153; mIC1 in mm9—chr7:149,767,625–149,767,705; mIC2 in mm9—chr7:150,482,365–150,482,486. Other details are described in the legend to Fig 1. (B) Percent methylation measured by pyrosequencing at two CTCF target sites (CTS1 and CTS6) in three different organs collected from H19hIC1Δ2.2/+ and H19hIC1/+ mice at birth (left panel). Endogenous mIC1 analysed as control of methylation: the paternal allele (pat) was assayed in H19hIC1Δ2.2/+, the maternal allele (mat) in H19+/hIC1Δ2.2, and both alleles (pat + mat) in H19+/+ mice (right panel). Each histogram represents the methylation mean value of 5 (CTS1 and mIC1) or 6 (CTS6) CpGs, tested in H19hIC1Δ2.2/+ (n = 10), H19hIC1/+ (n = 9) and H19+/+ (n = 7) mice derived from three litters. Bars represent the mean ± SEM. Note that methylation (ranging from 55% to 75%) was observed at the H19hIC1Δ2.2 and not at the H19hIC1 allele. (C) IC1 methylation analysed by bisulphite treatment followed by cloning and sequencing in tongue of H19hIC1/+ and H19hIC1Δ2.2/+ mice. Each line corresponds to a single template DNA molecule cloned; each circle corresponds to a CpG dinucleotide. Filled circles designate methylated cytosines; open circles, unmethylated cytosines. CpGs measured by pyrosequencing are framed.

