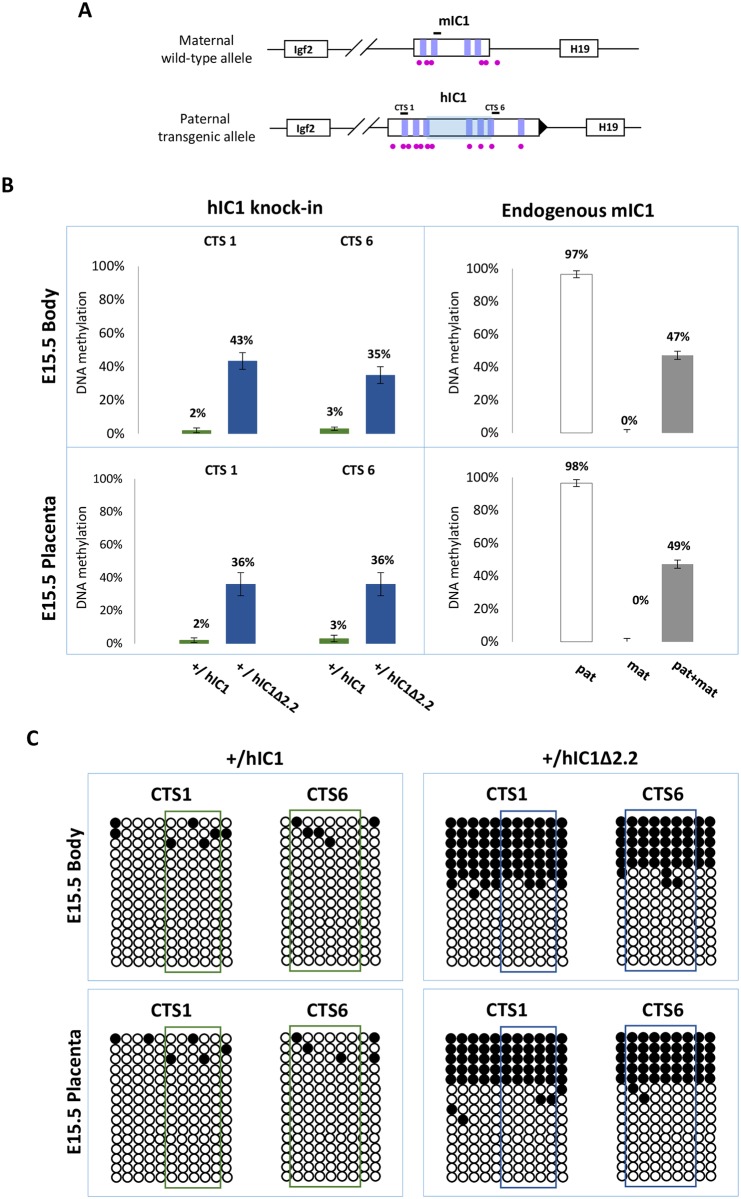
Fig 7. IC1 methylation in H19+/hIC1Δ2.2 and H19+/hIC1 mice at E15.5.
(A) See legend to Fig 4A. (B) Percent methylation measured by pyrosequencing at two CTCF target sites (CTS1 and CTS6) from embryo body and placenta of H19+/hIC1Δ2.2 and H19+/hIC1 mice at E15.5 (left panel). The endogenous mIC1 was analysed as in Fig 4. Each histogram represents the methylation mean value of 5 (CTS1 and mIC1) or 6 (CTS6) CpGs, tested in two litters of each KI: +/hIC1Δ2.2 (n = 6), +/+ (n = 5); +/hIC1 (n = 6) and +/+ (n = 4) embryos. Bars represent the mean ± SEM. (C) IC1 methylation analysed by bisulphite treatment followed by cloning and sequencing in embryo body and placenta of H19+/hIC1Δ2.2 and H19+/hIC1 mice at E15.5. See legend to Fig 4 for more details.

