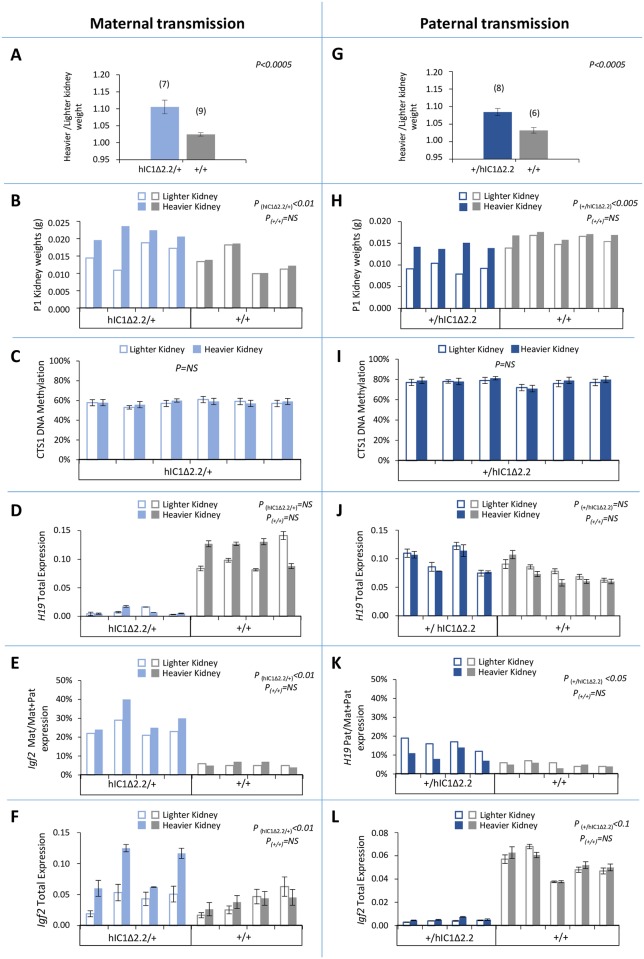
Fig 8. Kidney asymmetry and H19/Igf2 expression and imprinting on maternal and paternal transmission of the H19+/hIC1Δ2.2 allele.
(A-F) Analysis of maternal transmission. Weight difference of the kidneys at 12 weeks of age (A), kidney weights at birth (B), DNA methylation level of CTS1 (C), total H19 expression (D), allele-specific Igf2 expression (E), and total Igf2 expression (F) in heavier and lighter kidneys of H19hIC1Δ2.2/+ and H19+/+ mice. (G-L) Analysis of paternal transmission. Weight difference of the kidneys at 12 weeks of age (G), kidney weights at birth (H), DNA methylation level of CTS1 (I), total H19 expression (J), allele-specific H19 expression (K), and total Igf2 expression (L) analysed in heavier and lighter kidneys of H19+/hIC1Δ2.2 and H19+/+ mice. Bars in A and G represent the mean ± SEM. Bars in C-F and I-L represent the mean ± SEM of three technical replicates of the same sample. P-value calculated by two-tailed Student’s T-test on lighter vs heavier kidneys of littermates with the same genotype. The animals used for this study derived from two litters. Note that differences in weight, Igf2 expression and H19/Igf2 imprinting were present only in mice carrying the H19hIC1Δ2.2 allele.

