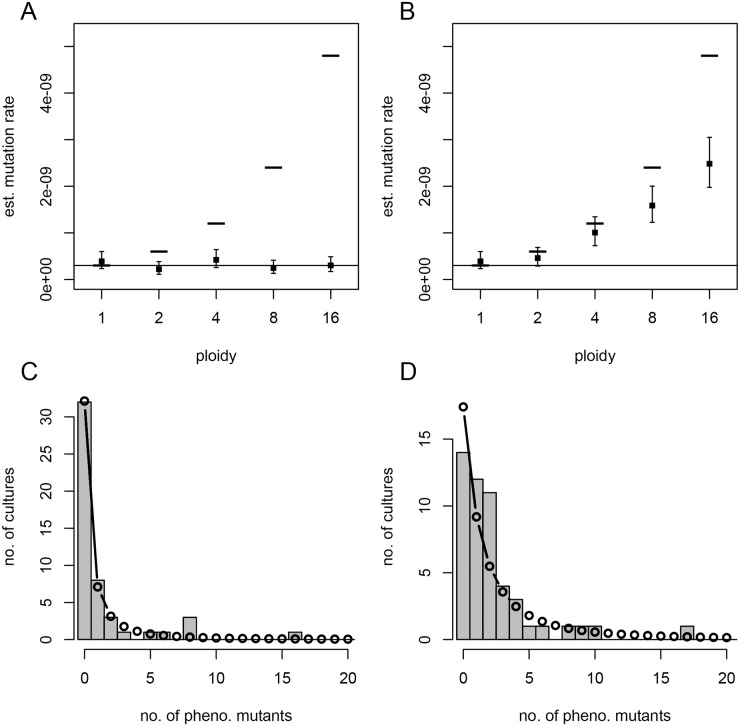
Fig 6. Simulated fluctuation tests.
Mutation rate estimates (MLEs, filled squares; and 95% confidence intervals, error bars) from 50 simulated parallel cultures at each ploidy (c), with constant mutant interdivision time, assuming either a recessive (A) or dominant (B) mutation. The lower solid line and upper dashes indicate the per-copy (μc = 3 × 10⁻¹⁰) and per-cell (c·μc) mutation rates, respectively, used for simulation. For c = 4 and recessive (C) or dominant (D) mutations, the observed mutant count distribution (histogram) is compared to that predicted by the standard model parameterized by the MLE mutation rate (connected points). This figure can be reproduced using code and simulated data deposited on Dryad (http://dx.doi.org/10.5061/dryad.8723-t). MLE, maximum likelihood estimate.

