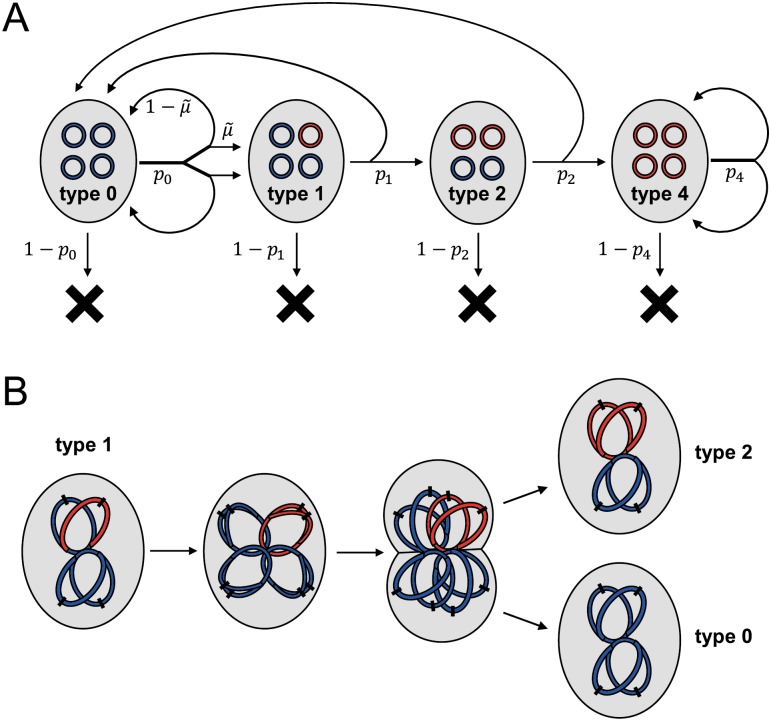
Fig 7. Schematic of the model used to evaluate SGV and rescue, illustrated for ploidy c = 4.
(A) Flow diagram of all events. A cell is represented by a grey oval, containing four chromosomes (complete or partial, so long as they contain the gene of interest). These chromosomes are colored blue if wild-type at the gene of interest or red if mutant. A cell either divides to produce two daughter cells with type-specific probability pj or otherwise dies. These probabilities pj differ between the old environment (to model SGV) and the new environment (to model rescue). Upon type 0 division, mutation (producing type 1) occurs with probability in each daughter cell; otherwise, the daughter is also type 0. In the remaining types, chromosome segregation determines the types of the daughter cells. (B) A mechanistic view of chromosome replication and segregation, illustrated for the production of one type 2 and one type 0 daughter cell from a type 1 mother cell. On each chromosome, the black dash indicates the origin of replication. SGV, standing genetic variation.

