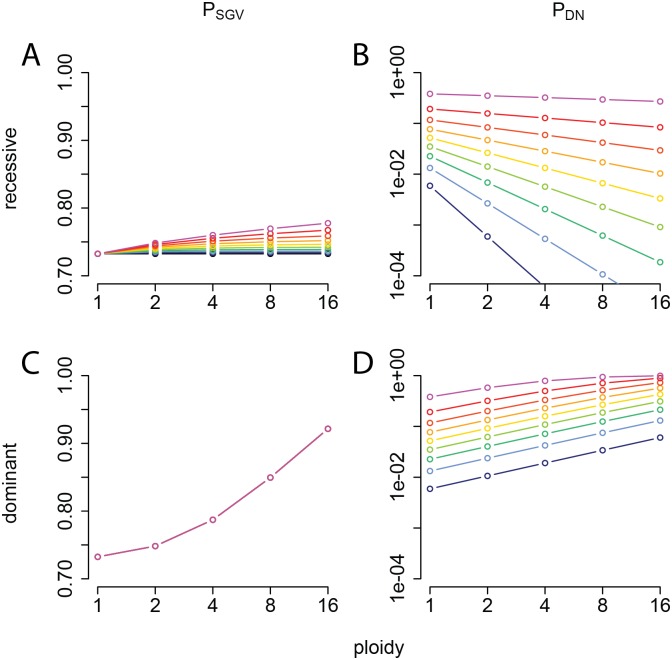
Fig 8. Impact of effective polyploidy on the probability of evolutionary rescue.
(A, C) The probability that at least one mutation from the SGV survives in the new environment (PSGV; linear scale) and (B, D) the probability that at least one mutation arises in the new environment and survives (PDN; log scale), plotted as a function of ploidy, for a recessive mutation (A, B) or a dominant mutation (C, D). The different colored curves indicate probability of division before death of phenotypically wild-type (sensitive) cells in the new environment, pS, varying from 0 (black) to 0.45 (magenta) in increments of 0.05. The remaining parameters are fixed: probability of division before death of phenotypically mutant (resistant) cells, pR = 0.9; mutational cost in the old environment, s = 0.1; population size at the time the environment changes, N = 2 × 10⁸; and per-copy mutation rate, . This figure can be reproduced using code deposited on Dryad (http://dx.doi.org/10.5061/dryad.8723t). SGV, standing genetic variation.

