Figure 3.
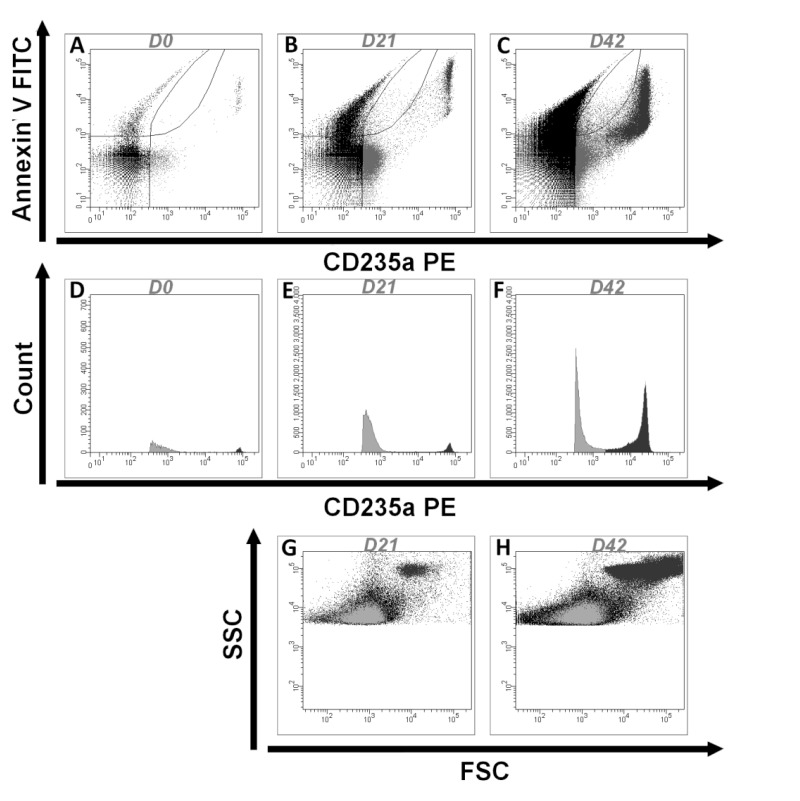
Results obtained from flow cytometry for one donor (RC07). (A–C).
The REVs detected at D0 (A), D21 (B) and D42 (C) are shown according to their labeling by annexin V and CD235a. The number of REVs greatly increases during storage. Among REV (CD235a+ events), the majority are annexin V− at the end of storage. (D–F) The REV detected on D0 (D), D21 (E) and D42 (F) are shown according to their count and their labelling of CD235a. Two subpopulations of annexin V− REV can be identified; one majority population that expresses CD235a (glycophorin A) moderately (in light grey) and the other population that expresses CD235a strongly (in dark grey). (G,H) The distribution of the REV is illustrated by a forward scatter (FSC) and side scatter (SSC) plot on D21 (G) and D42 (H), showing the heterogeneity of the FSC-SSC of the two populations of REV expressing glycophorin A (in grey). REV: extracellular vesicles of red blood cell origin.

