
Figure 2.
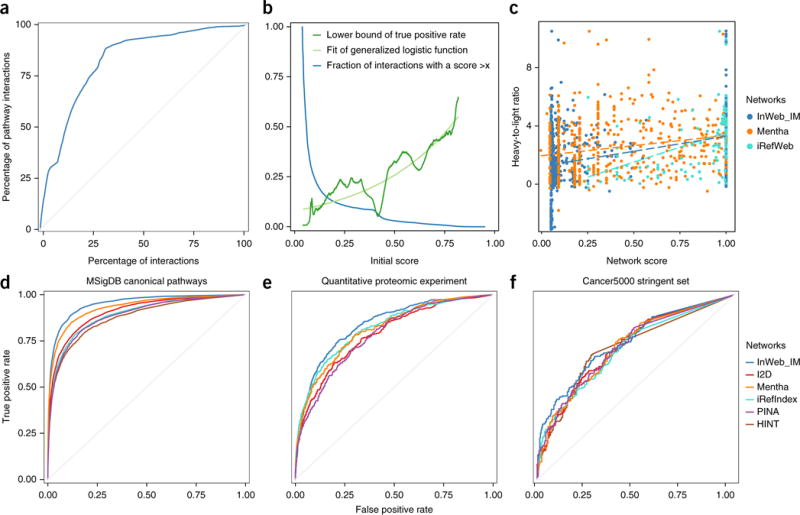
Validating the InWeb_IM score and comparing its biological signal to those of five other networks. (a) A plot of the cumulative fraction of the gold-standard set (pathway-database-derived interactions) as a function of the rank based on the initial score (normalized to percentages) (AUC = 0.83). (b) Calibration of the initial score against the gold-standard interactions (dark green line for initial data points and light green line for the fitted general logistic function; the blue line shows the fraction of interactions with scores higher than the values indicated on the x axis.). (c) Correlation of confidence scores from InWeb_IM, Mentha, and iRefIndex and experimental values of the confidence of binding between proteins (i.e., the heavy-to-light isotope ratios from mass spectrometry data of 58 independent human immunoprecipitations). (d) Cross-validation to test the ability of the six networks to recapitulate pathway relationships between genes in 853 MSigDB canonical pathways through a 30% holdout analysis. InWeb_IM AUC = 0.95; Mentha AUC = 0.93; I2D AUC = 0.91; iRefIndex and PINA AUCs = 0.89; and HINT AUC = 0.88. (e) Agreement between interactions reported in each network with quantitative protein–protein interactions from 58 immunoprecipitations in human cells. InWeb_IM AUC = 0.84; iRefIndex AUC = 0.82; Mentha AUC = 0.81; I2D AUC = 0.79; and PINA AUC = 0.78. (f) Ability of networks to classify 219 cancer genes. InWeb_IM AUC = 0.74; I2D, Mentha, and PINA AUCs = 0.72; and HINT and iRefIndex AUCs = 0.71.