
Figure 1.
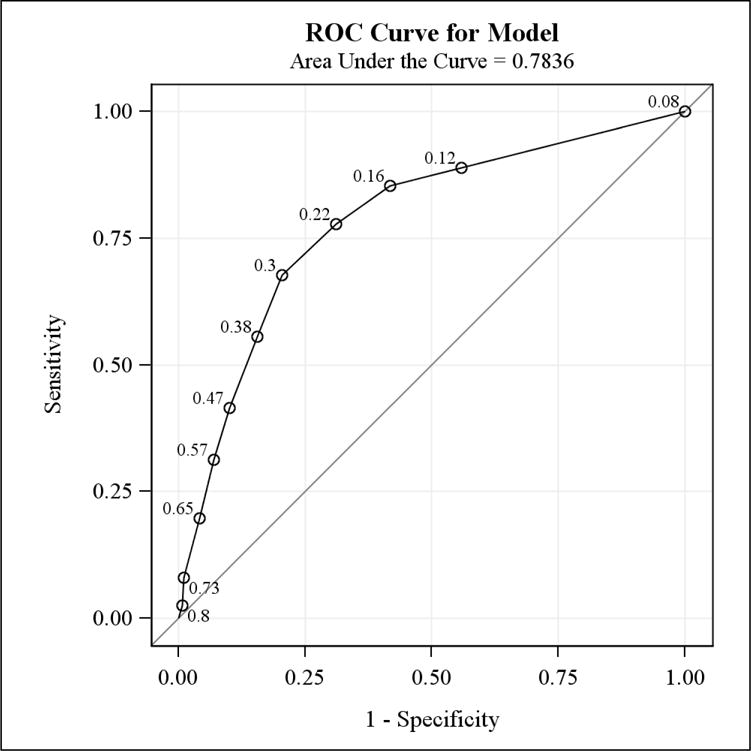
ROC Curve from Model predicting High Distress using the BHS Score from the NCCN Score: The MHADRO Study
* Labeled points on the ROC curve correspond to the average high distress score (measured on a 0-1 scale from the BHS) at each value of the NCCN thermometer. For example, at a thermometer score of 3 (read from the top right corner), the average high distress score 0.22.