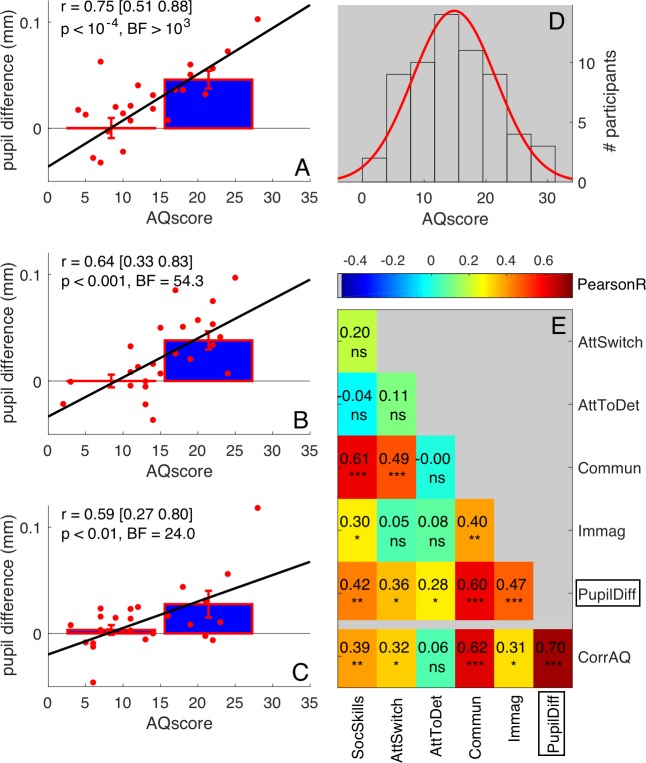
Figure 3. Robustness of correlations between pupil difference and AQ scores.
(A–C) Correlations of the signed amplitude of pupil difference (or ‘luminance-dependent’ pupil modulation) with AQ scores separately for our three self-replications: two sessions of the main experiment tested on different subsamples of participants (A-B, 25 participants each, pooled in Figure 1C of the main text) and the ‘swapped motion direction’ experiment (C, 26 participants). Bars show averages and s.e.m. for participants with AQ score below and above the median AQ score in our pool, and continuous lines show the best fit linear function across results from all participants (red dots). Text insets give Pearson’s correlation coefficients and associated p-values. (D) Distribution of AQ scores in our sample of participants, with best fit Gaussian function. (E) Correlation matrix between the pupil difference in the ‘main’ experiment (N = 50, pooling across panels A and B, as done in Figure 1C of the main text) and each AQ subscale. The bottom row shows correlations with the corrected total AQ: between the pupil difference and the total AQ, or between each subscale and the sum of the other four subscales. Pearson’s r values are colour coded and given by the text with associated significance values (*p<0.05, **p<0.01, **p<0.001, ns non-significant).

