. 2018 Mar 6;7:e32288. doi: 10.7554/eLife.32288

Figure 5. Phagocytosis is required for efficient oxidation of roGFP2-based probes.

Figure 5.

Cytochalasin D inhibits phagocytosis of E. coli (A) and FITC-labeled Zymosan (B) as determined by flow cytometry. Cytochalasin D (CD) treatment of differentiated PLB-985 cells inhibits oxidation of roGFP2-Orp1 expressed in E. coli (C). Similar findings were observed in bacteria expressing Grx1-roGFP2 (D) and unfused roGFP2 (E). Arrows indicate the addition of medium, differentiated, neutrophil-like PLB-985 cells and cytochalasin D-treated differentiated PLB-985 cells.

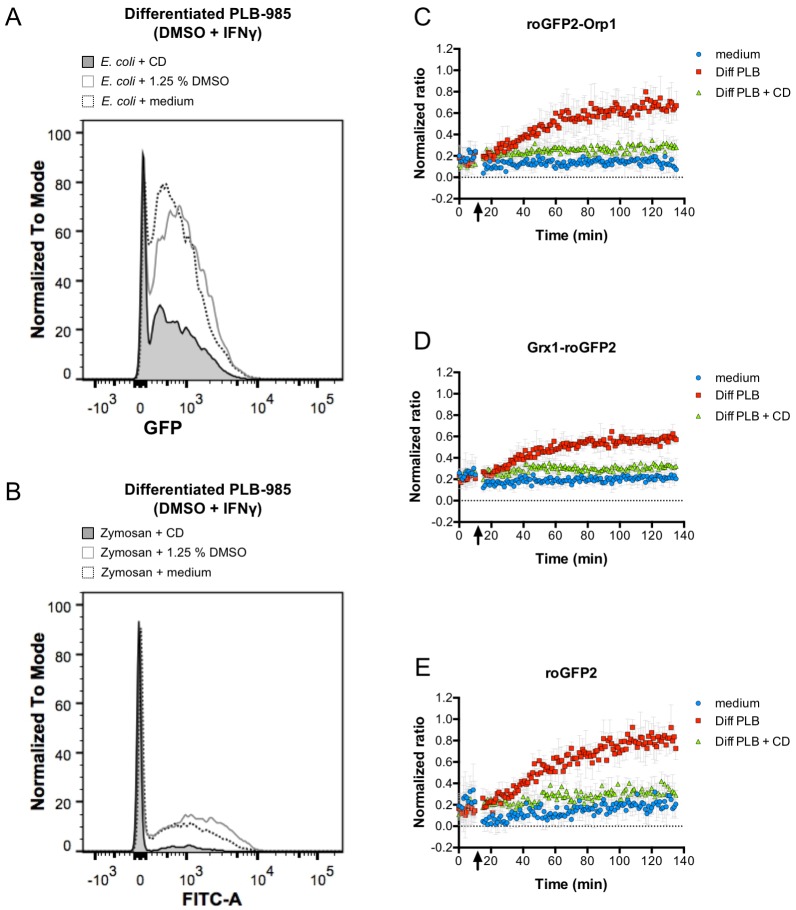
Figure 5—source data 1. Numerical flow cytometry data represented in Figure 5A, trace E. coli + CD.
DOI: 10.7554/eLife.32288.045
Figure 5—source data 2. Numerical flow cytometry data represented in Figure 5A, trace E. coli + 1.25% DMSO.
DOI: 10.7554/eLife.32288.046
Figure 5—source data 3. Numerical flow cytometry data represented in Figure 5A, trace E. coli + medium.
DOI: 10.7554/eLife.32288.047
Figure 5—source data 4. Numerical flow cytometry data represented in Figure 5B, trace Zymosan + CD.
DOI: 10.7554/eLife.32288.048
Figure 5—source data 5. Numerical flow cytometry data represented in Figure 5B, trace Zymosan + 1.25% DMSO.
DOI: 10.7554/eLife.32288.049
Figure 5—source data 6. Numerical flow cytometry data represented in Figure 5B, trace Zymosan + medium.
DOI: 10.7554/eLife.32288.050
Figure 5—source data 7. Numerical fluorescence plate reader data represented in Figure 5C.
DOI: 10.7554/eLife.32288.051
Figure 5—source data 8. Numerical fluorescence plate reader data represented in Figure 5D.
DOI: 10.7554/eLife.32288.052
Figure 5—source data 9. Numerical fluorescence plate reader data represented in Figure 5E.
DOI: 10.7554/eLife.32288.053