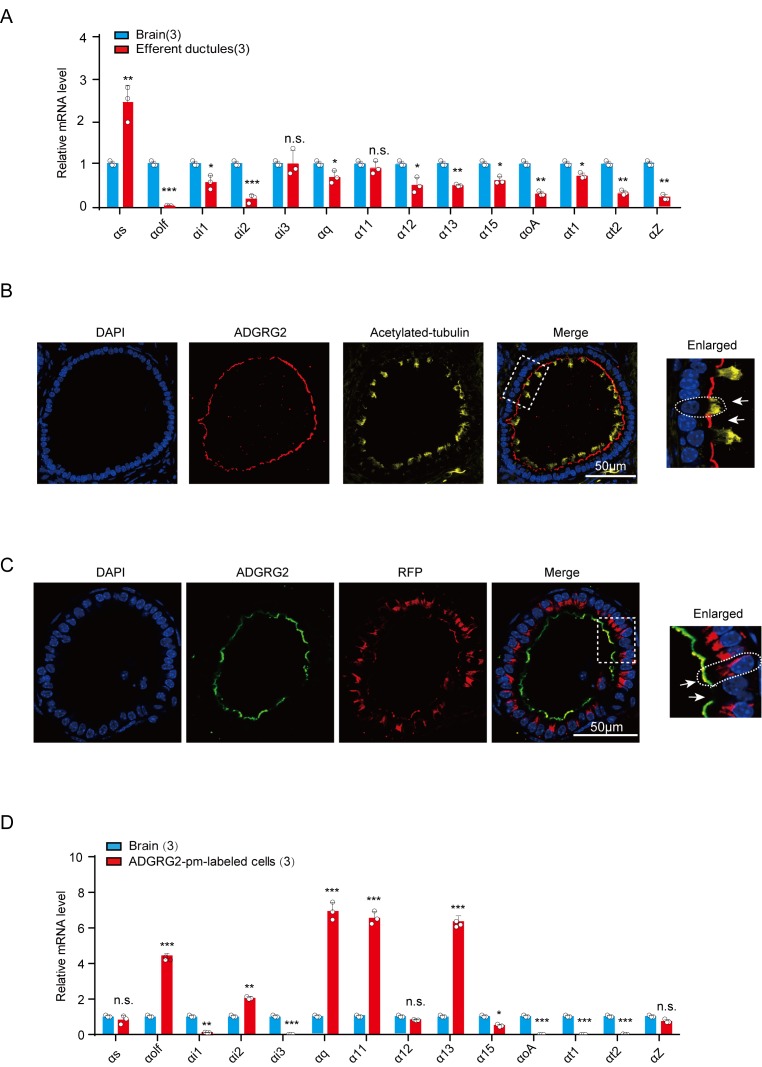
Figure 1. The expression of G protein subtypes in the efferent ductules and ADGRG2 promoter-labeled non-ciliated cells.
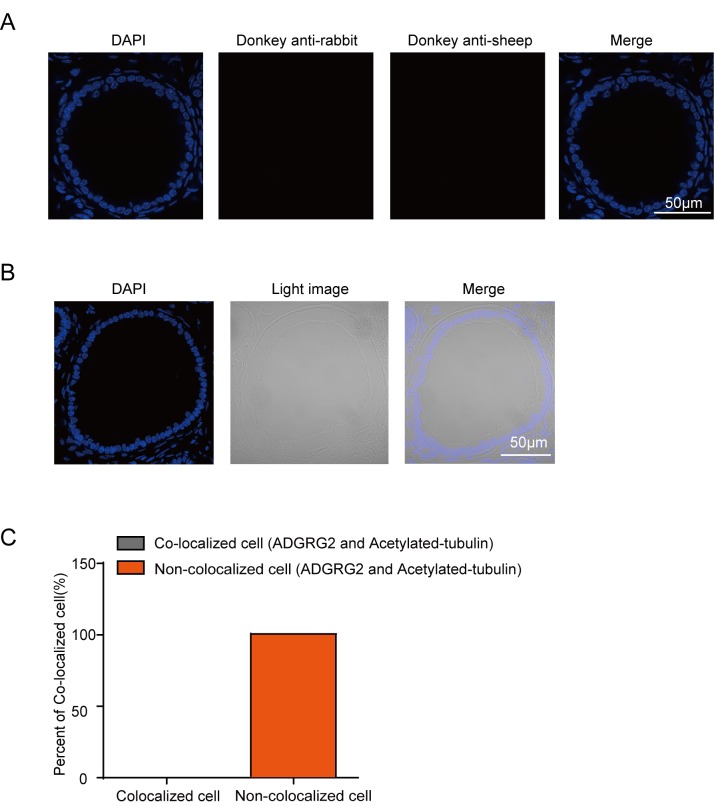
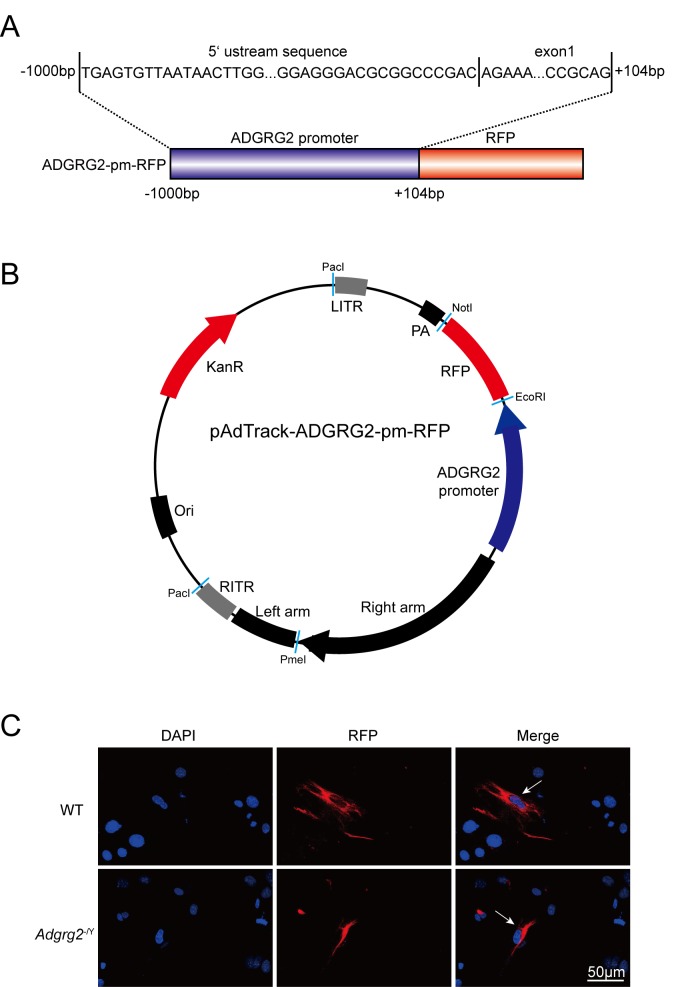
(A) qRT-PCR analysis of mRNA transcription profiles of G proteins in brain tissues and the efferent ductules of WT (n = 3) male mice. Expression levels were normalized to GAPDH levels. *p<0.05, **p<0.01, ***p<0.001, efferent ductules compared with brain tissue. (B) Co-localization analysis of ADGRG2 (red fluorescence) and acetylated-tubulin (green fluorescence) in the efferent ductules of WT mice. Scale bars, 50 μm. (C) Co-localization of ADGRG2 (green fluorescence) and RFP (red fluorescence) in the same cells of male murine efferent ductules infected with the ADGRG2 promoter RFP adenovirus in WT mice. Scale bars, 50 μm. (D) qRT-PCR analysis of mRNA transcription profiles of G protein subtypes in brain tissues and isolated ADGRG2 promoter-labeled non-ciliated cells derived from the efferent ductules of WT (n = 3) male mice. Expression levels were normalized to GAPDH levels. *p<0.05, **p<0.01, ***p<0.001, ADGRG2 promoter-labeled efferent ductule cells compared with brain tissues. n.s., no significant difference. At least three independent biological replicates were performed for Figure 1A and D.


