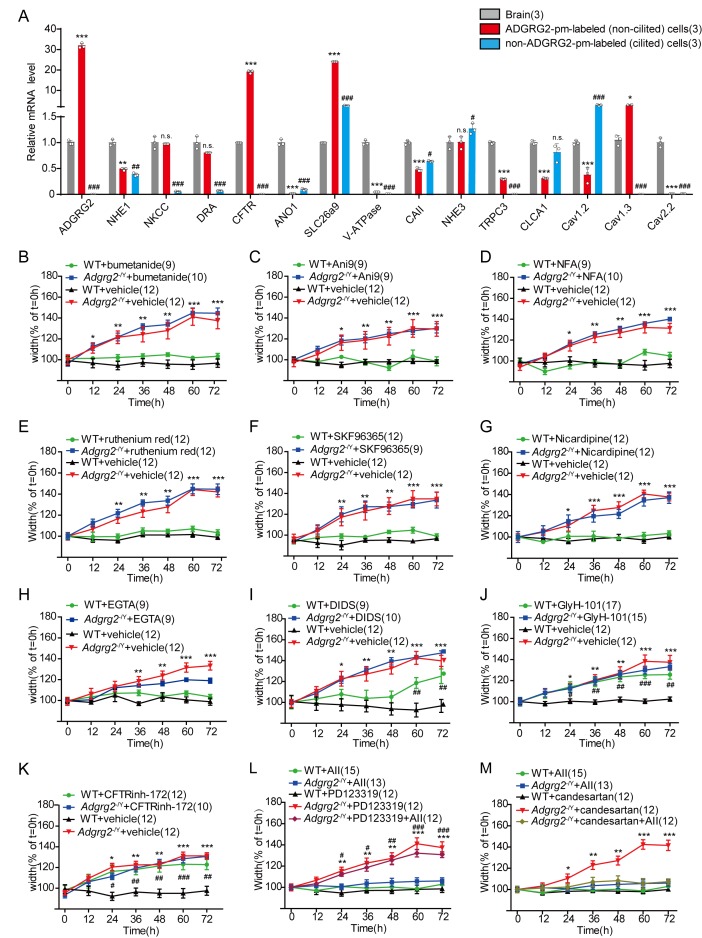
Figure 4. Inhibition of CFTR activity in the efferent ductules pheno-copied the activity in Adgrg2-/Y mice.
(A) qRT-PCR analysis of the mRNA transcription profiles of potential osmotic drivers including selective ion channels and transporters in ADGRG2 promoter-labeled cells, non-ADGRG2 promoter-labeled cells and brain tissues of WT (n = 3) male mice. Expression levels were normalized to GAPDH levels. *p<0.05, **p<0.01, ***p<0.001, ADGRG2 promoter-labeled cells were compared with brain tissues. #p<0.05, ##p<0.01, ###p<0.001, non-ADGRG2 promoter-labeled cells were compared with brain tissues. (B–M) Effects of different channel blockers on the diameters of luminal ductules derived from WT or Adgrg2-/Y mice. (B) Bumetanide (10 μM), an NKCC blocker, WT (n = 9) or Adgrg2-/Y (n = 10); (C) Ani9 (150 nM), an ANO1 inhibitor, WT (n = 9) or Adgrg2-/Y (n = 9); (D) NFA (20 μM), a CaCC inhibitor, WT (n = 9) or Adgrg2-/Y (n = 10); (E) ruthenium red (10 μM), a non-specific TRP channel blocker, WT (n = 12) or Adgrg2-/Y (n = 12); (F) SKF96365 (10 μM), a TRPC channel inhibitor, WT (n = 12) or Adgrg2-/Y (n = 9); (G) nicardipine (20 μM), an L-type calcium channel blocker, WT (n = 12) or Adgrg2-/Y (n = 12); (H) EGTA (5 mM), an extracellular calcium chelator, WT (n = 9) or Adgrg2-/Y (n = 9); (I) DIDS (20 μM), a chloride-bicarbonate exchanger blocker, WT (n = 9) or Adgrg2-/Y (n = 10); (J) GlyH-101 (25 μM), a non-specific CFTR inhibitor, WT (n = 17) or Adgrg2-/Y (n = 15); (K) CFTRinh-172(10 μM), a specific CFTR inhibitor, WT (n = 12) or Adgrg2-/Y (n = 10). (L) Effects of angiotensin II (100 nM, an angiotensin receptor agonist) and PD123319 (1 μM, an AT2 receptor antagonist) on the diameters of luminal ductules derived from WT or Adgrg2-/Y mice (n ≥ 12). (M) Effects of angiotensin II (100 nM) and candesartan (1 μM, an AT1 receptor antagonist) on the diameters of luminal ductules derived from WT or Adgrg2-/Y mice (n ≥ 12). Application of GlyH-101 and CFTRinh-172 to ligated ductules derived from WT mice recapitulated the phenotype of the ductules derived from Adgrg2-/Y mice. (4A-M)*p<0.05, **p<0.01, ***p<0.001; Adgrg2-/Y mice compared with WT mice. #p<0.05, ##p<0.01, ###p<0.001. Treatment with selective inhibitors or stimulators was compared with control vehicles. n.s., no significant difference. At least three independent biological replicates were performed for Figure 4A–M.


