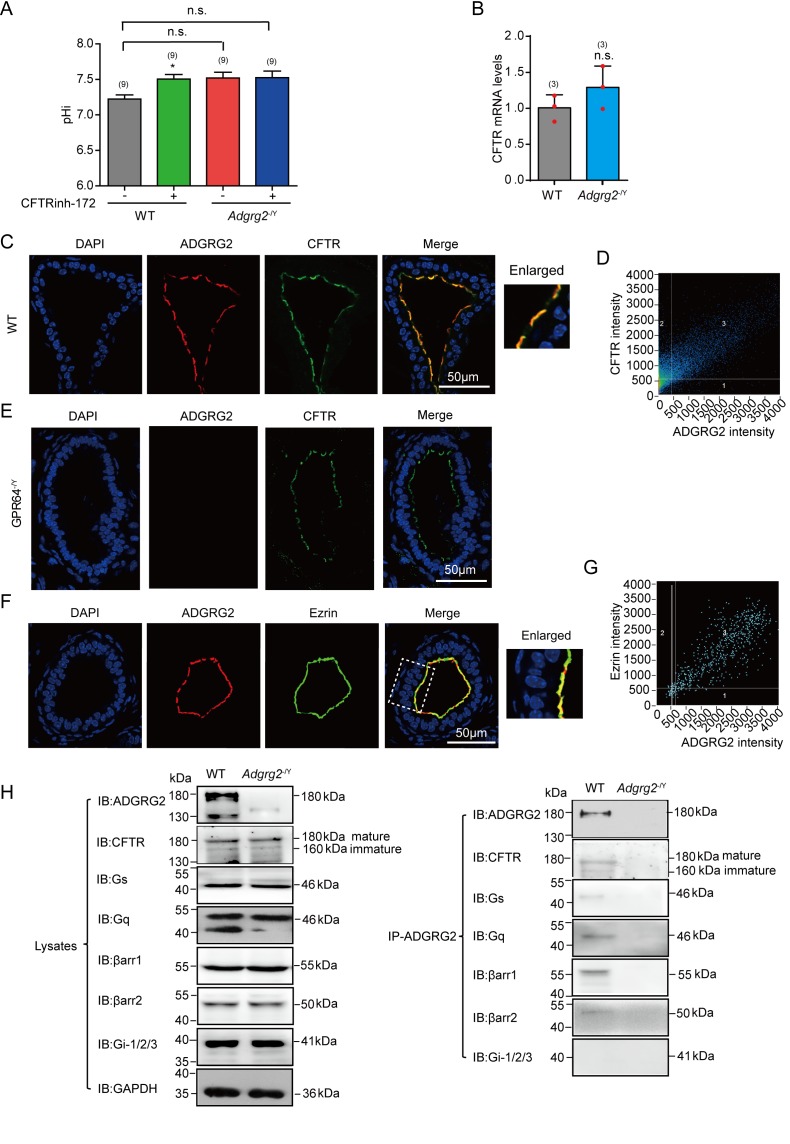
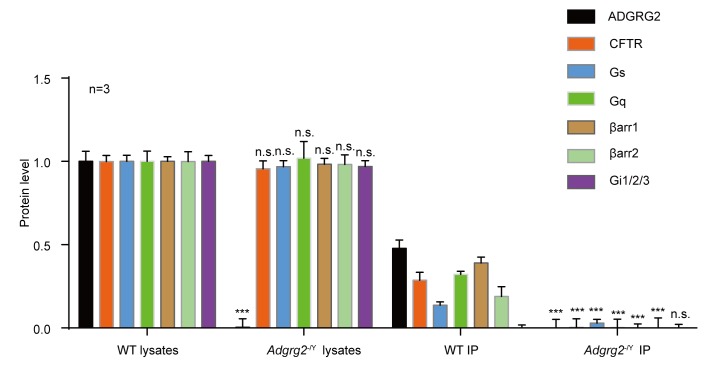
Figure 5. Functional coupling and co-localization of CFTR and ADGRG2 on the apical membrane in the efferent ductules.
(A) Intracellular pH (pHi) of the ligated efferent ductules from WT (n = 9) mice and Adgrg2-/Y (n = 9) mice were measured by carboxy-SNARF (5 μM), with or without incubation with the CFTR inhibitor CFTRinh-172. (B) qRT-PCR analysis of CFTR levels in the efferent ductules of WT (n = 3) or Adgrg2-/Y (n = 3) mice. (C) Co-localization of ADGRG2 (red fluorescence) and CFTR (sc-8909, Santa Cruz, green fluorescence) in the male efferent ductules of WT mice. Scale bars, 50 μm. (D) Analysis of ADGRG2 and CFTR fluorescence intensities by Pearson’s correlation analysis. The Pearson's correlation coefficient was 0.76. (E) Immunofluorescence staining of ADGRG2 (red fluorescence) and CFTR (sc-8909, Santa Cruz, green fluorescence) in the efferent ductules of Adgrg2-/Y mice. Scale bars, 50 μm. (F) Co-localization of ADGRG2 (red fluorescence) and ezrin (green fluorescence) in the male efferent ductules of WT mice. Scale bars, 50 μm. (G) Analysis of ADGRG2 and ezrin fluorescence intensities by Pearson’s correlation analysis. The Pearson's correlation coefficient was 0.69. (H) ADGRG2 was immunoprecipitated with an anti-ADGRG2 antibody from the male efferent ductules of WT mice or Adgrg2-/Y mice, and co-precipitated CFTR, Gs, Gq, β-arrestin-1, β-arrestin-2 and Gi-1/2/3 levels were examined by using specific corresponding antibodies (CFTR antibody:20738–1-AP, Proteintech). (5A-5B) *p<0.05, **p<0.01, ***p<0.001, Adgrg2-/Y mice compared with WT mice. #p<0.05, ##p<0.01, ###p<0.001. Treatment with selective inhibitors or stimulators was compared with control vehicles. n.s., no significant difference. At least three independent biological replicates were performed for Figure 5A–B.
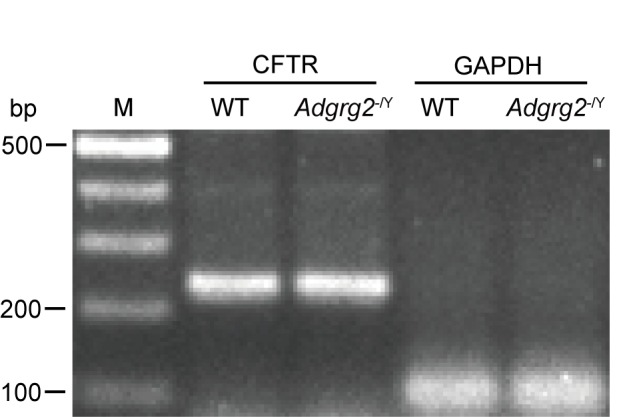
Figure 5—figure supplement 1. Representative agrose gel for the reverse transcription PCR analysis of CFTR mRNA level in efferent ductules of WT or Adgrg2-/Y mice.
