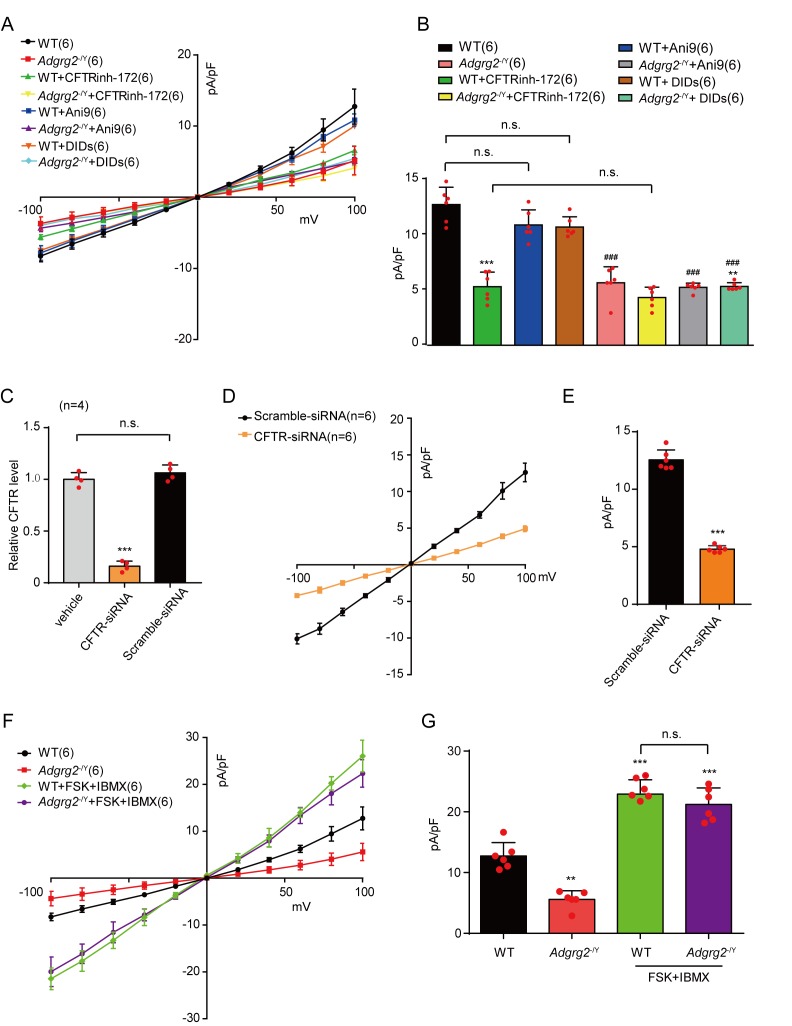
Figure 7. Cl- currents in the non-ciliated cells of the efferent ductules through CFTR.
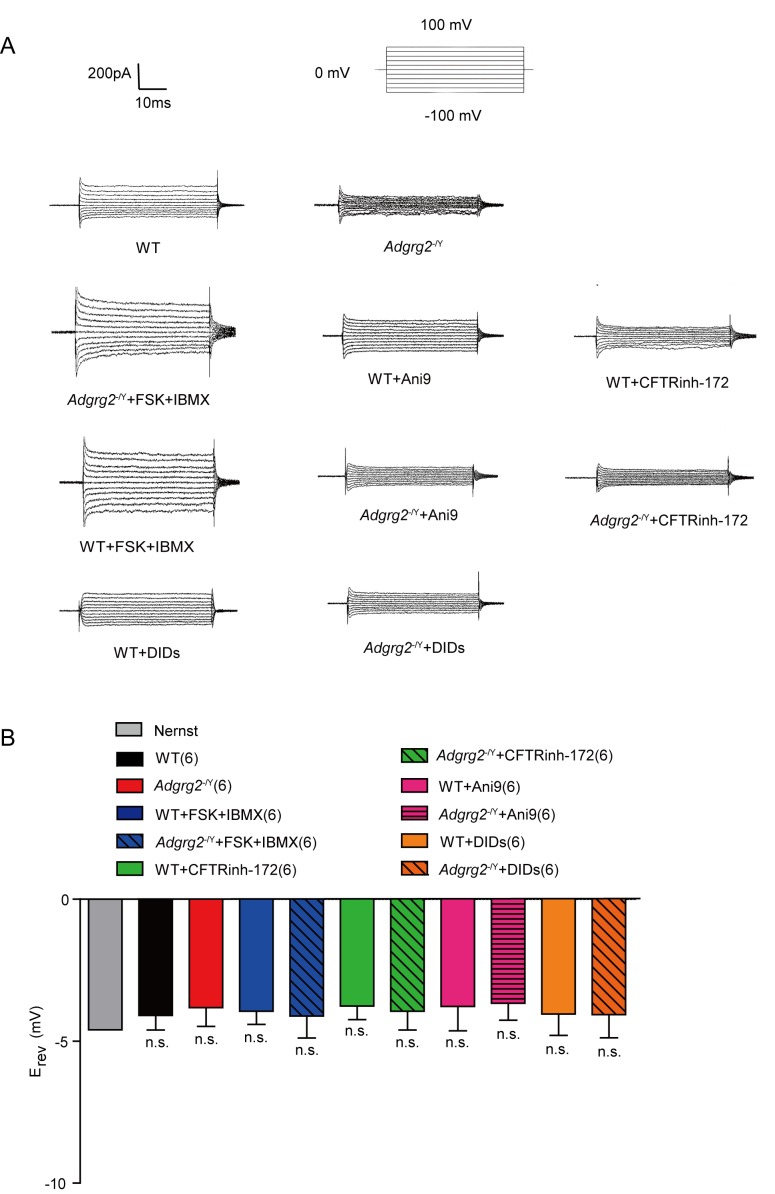
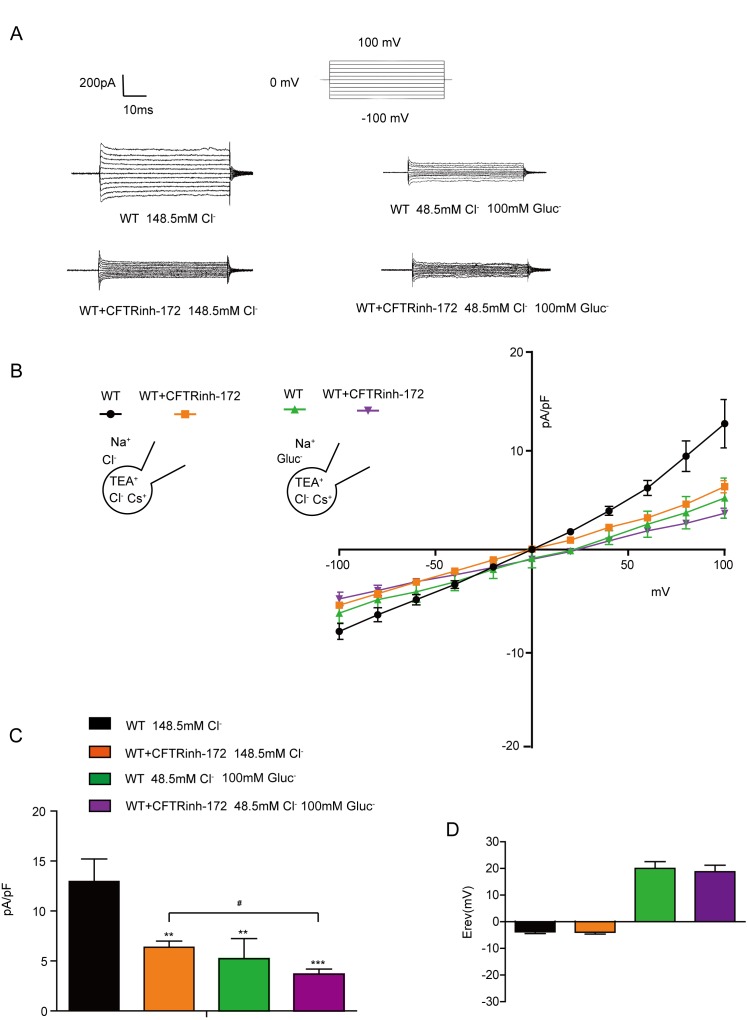
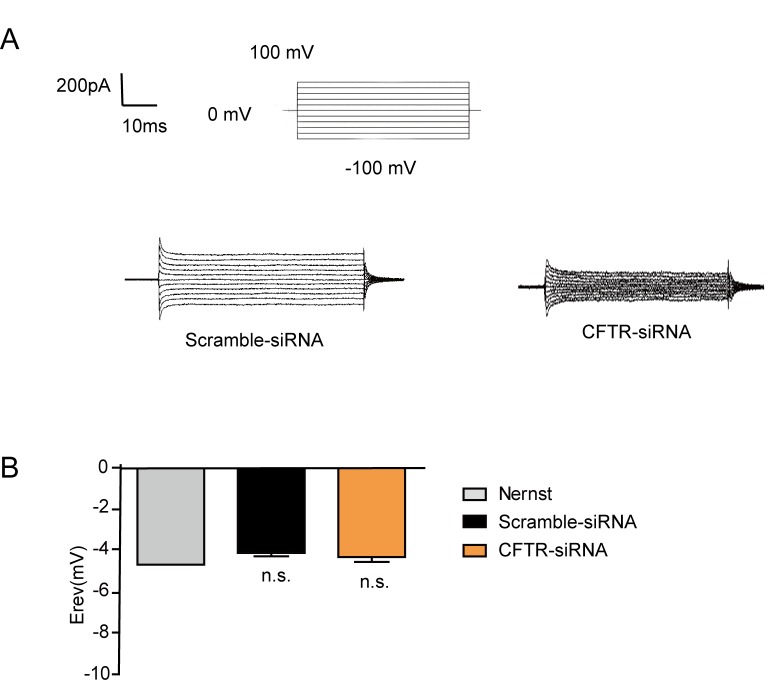
(A, D and F) Corresponding I-V curves of the whole-cell Cl- IADGRG2-ED currents recorded in Figure 6 and (A, D and F) Corresponding I-V curves of the whole-cell Cl- IADGRG2-ED currents recorded in Figure 7—figure supplement 1(A,F) and Figure 7—figure supplement 3(D). WT (n = 6), Adgrg2-/Y (n = 6); WT +CFTRinh-172 (n = 6), Adgrg2-/Y+CFTRinh-172 (n = 6), WT +ANI9 (n = 6), Adgrg2-/Y+ANI9 (n = 6), WT +DIDS (n = 6), Adgrg2-/Y+DIDS (n = 6); WT +Control RNAi (n = 6), WT +CFTR RNAi (n = 6), Adgrg2-/Y+Control RNAi (n = 6), Adgrg2-/Y+CFTR RNAi (n = 6); WT +FSK + IBMX (n = 6), Adgrg2-/Y+FSK+IBMX (n = 6). (B,E and G) Corresponding bar graph depicting the average current densities (pA/pF) measured at 100 mV in (A), (D) and (F). (C) qRT-PCR analysis of CFTR levels in the efferent ductules treated with CFTR siRNA (n = 3) or control RNAi (n = 3). (B, E and G) *p<0.05, **p<0.01, ***p<0.001, Adgrg2-/Y mice compared with WT mice. #p<0.05, ##p<0.01, ###p<0.001. Treatment with selective inhibitors, stimulators or CFTR RNAi was compared with control vehicles or control RNAi. n.s., no significant difference. At least three independent biological replicates were performed for Figure 7B,E and G.


