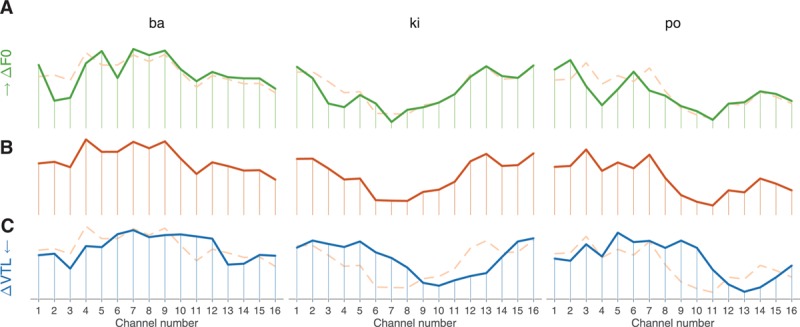
Fig. 5.

Summary electrodograms for three syllables. The summary electrodogram shows the average power in each channel over the course of the syllable. The middle curve (B) shows the original version of the stimulus, while the top (A) and bottom (C) curves correspond to an F0 shift of 1 just-noticeable difference (JND) and a vocal-tract length (VTL) shift of 1 JND, respectively. The curves corresponding to the original version of the stimulus are repeated, as dashed lines, behind the F0 and VTL shifted version to facilitate comparison. The average power is normalized and, thus, presented without units here.
